


EN
Why Is Silver’s Price Volatile?
Gold and silver are like peas and carrots. The two leading precious metals often move in the same direction. On January 29, 2026, gold reached an all-time high of $5,626.80 per ounce. That same day, silver rose to a record high of $121.785 per ounce. Gold and silver prices have plunged since the 2026 high, making lower highs and lower lows.
I asked what will get silver prices moving in an October 6, 2026, Barchart article, when I concluded with the following:
The optimal approach to silver trading or investing is to go with the flow, using a risk-reward plan that includes stops and profit horizons. It is acceptable to adjust profit horizons when silver’s price moves in the anticipated direction, but it is critical to adjust stop levels to protect profits and capital. When price moves against expectations, sticking to stop levels will protect capital. Trading with the flow in silver requires accepting short-term losses to pursue substantial gains as significant trends develop. When trends bend, stops protect against oversized losses, as silver market participants experienced in late January and early February 2026. It is virtually impossible to pick tops or bottoms in any market, and this is particularly true in the silver futures market. Discipline, a plan, and logical risk-reward dynamics are critical factors for success in silver trading and investing.
Many factors can move silver’s price, but the potential for short-term head-fake moves remains high as the price stays in its current consolidation range.
Nearby COMEX silver futures traded at $61.32 per ounce on October 5, 2026, and were substantially lower in November, and have since declined below the $45 per ounce level. Many factors account for silver’s volatility, which should continue through the rest of 2026 and into 2027.
Silver’s historical volatility is twice gold’s
On October 30, 2026, nearby COMEX silver futures fell below its critical technical support level. The 1980 high of $50.36 per ounce had been technical resistance for 45 years, then became long-term support in October 2025 when silver’s price exploded above it. One year later, on October 30, silver fell below the 1980 high for the first time.
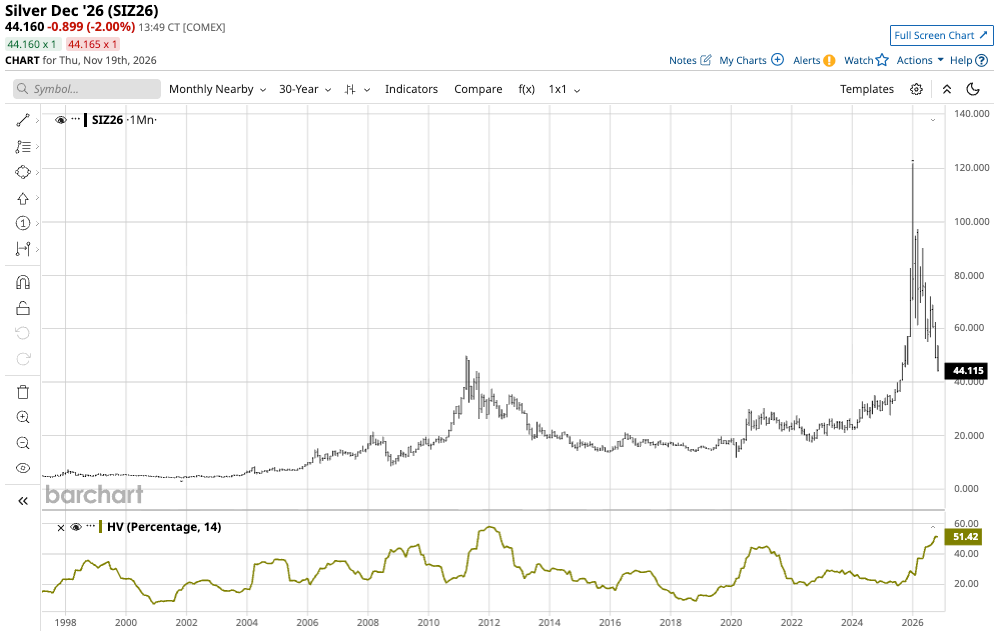
The monthly chart shows that silver’s price fell to a low of $43.955 on November 19. Monthly historical volatility at 51.42% rose to its highest level since 2012 as silver fell to a new 2026 low, below its long-term support at the 1980 $50.36 high.
Gold also declined to a new 2026 low on November 19, 2026.
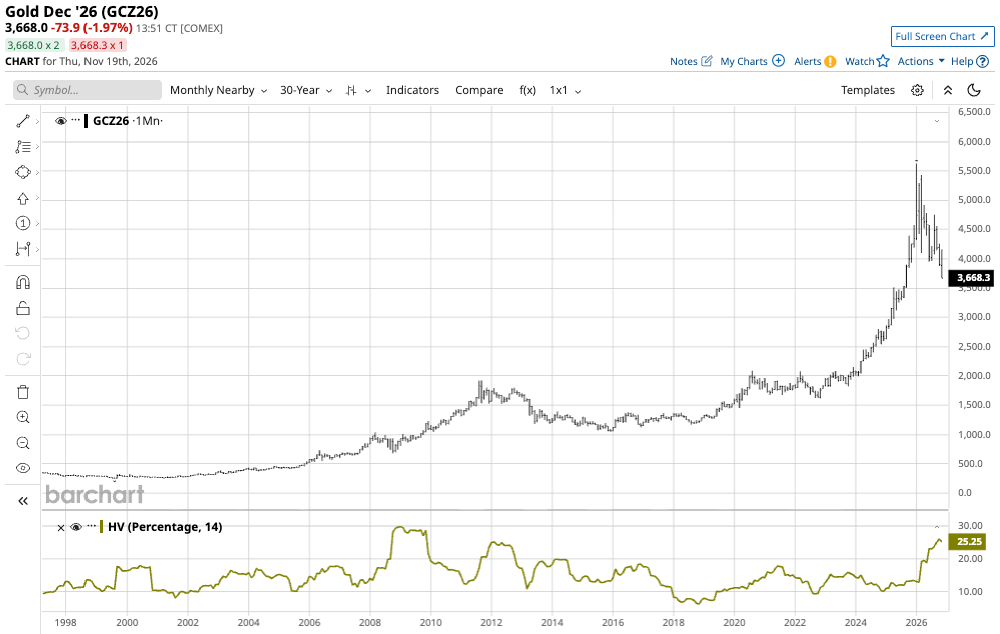
The monthly chart shows gold’s price fell to $3,667.80 on November 19. Monthly historical volatility at 25.25% rose to its highest level since 2009 as gold fell to a new 2026 low. While silver declined below its 1980 high, gold’s 1980 high of $875 remains far below its current price level. Meanwhile, silver’s historical volatility is approximately double gold’s, as silver is a far more speculative precious metal.
Fundamentals are bullish; technicals support a bounce higher
2026 is the sixth consecutive year when silver demand has exceeded supply. The Silver Institute forecasts a shortfall of 46.3 million ounces in 2026, higher than the 40.3 million ounce deficit in 2025. While industrial demand for silver continues to grow, mine supply is forecast to stay flat, and total supply could be 2% lower in 2026.
Meanwhile, fundamentals are only part of the story. Silver’s trend since the 2020 pandemic-inspired low remains higher.
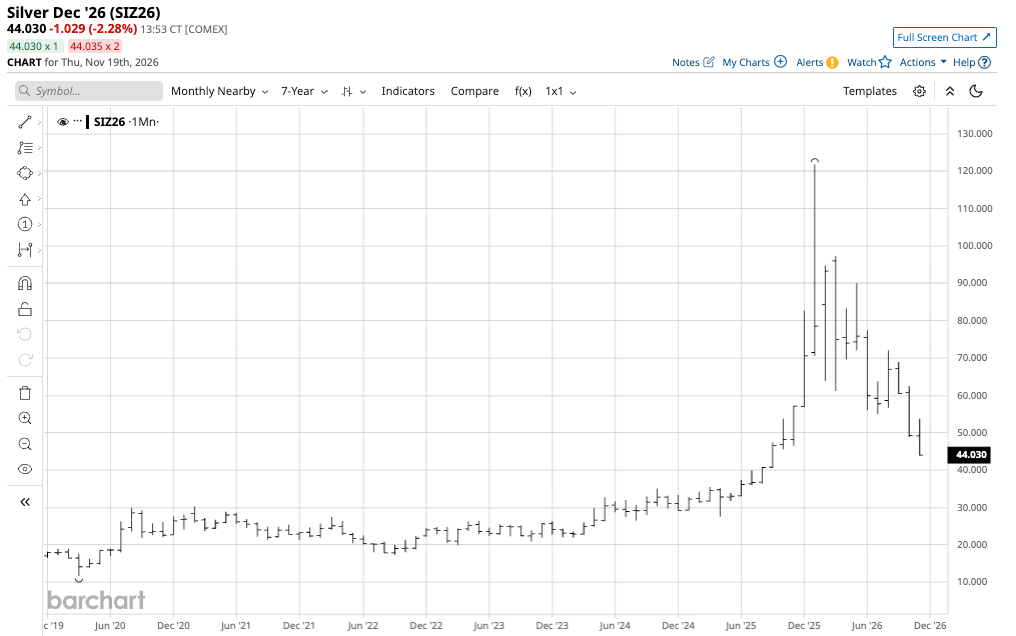
The 7-year monthly continuous contract chart shows silver’s price rose by more than ten times from the March 2020 low of $11.64 to the January 2026 high of $121.785 per ounce. Technical support on the monthly chart now stands at the September 2025 low of $40.555 per ounce, the month before silver’s price broke out above the 1980 high of $50.36.
Sentiment is critical for silver as it drives investment demand and speculative interest
In the 2004 book, The Wisdom of Crowds, author James Surowiecki described through case studies how large groups of people are often smarter and make better decisions than so-called “experts.” Markets perfectly embody Surowiecki’s thesis. A crowd of buyers and sellers, often with different motivations, determines the current price, which is always the correct price at the moment because it is the level where buyers and sellers meet in a transparent marketplace.
Silver has a long history as a highly speculative market. Nearly half a century ago, the Hunt Brothers’ attempt to corner the silver market in the late 1970s and 1980, drove the price over $50 per ounce for the first time; it was a speculative foray that caused a crowd of buyers to follow on the way up with long risk positions and follow on the way down with short risk positions. In all markets, the trend is always a trader’s or investor’s best friend, and nowhere is that clearer than silver. However, silver’s speculative nature can make it a bucking bronco as herd sentiment can change on a dime.
Throughout history, silver’s volatility has caused central banks and governments to abandon silver as a reserve asset. Spain became one of the world’s wealthiest countries in the 1500s after its explorers discovered a massive silver reserve in Bolivia. However, silver price volatility and speculation drove prices down, taking away Spain’s wealth.
The bottom line is that investment and speculative demand set silver’s price path. The crowd loved silver in 2025 and early 2026, pushing the price to a record high of over $120 per ounce. The crowd has soured on silver in 2026, pushing the price below the $50 per ounce technical support level in late October. As the Hunts and many others throughout history learned, silver has a way of making a large fortune into a small one.
Expect silver to surprise as it fell below a critical price level
The bullish trend that began in October 2025 and took silver above its 1980 high ended one year later, on October 30, 2026, when the price fell below $50 per ounce. While silver has moved into a bear market, there is a chance that the decline will turn out to be a massive head fake and silver will return to $50 over the coming weeks, and perhaps months, before fundamentals take hold and the sentiment changes from bearish liquidation to bullish accumulation.
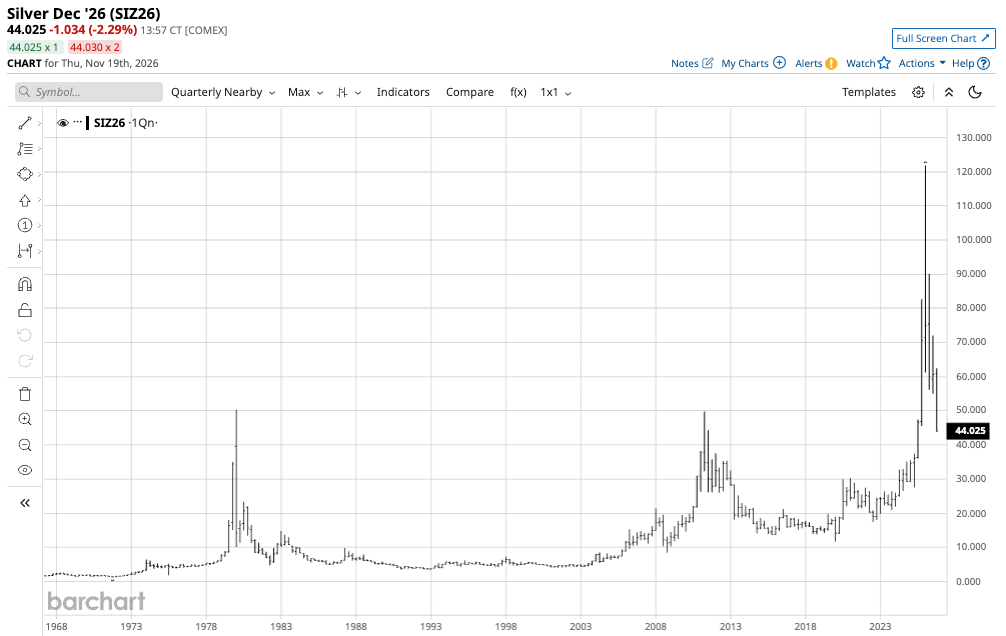
The quarterly chart shows silver became a shooting star in late 2025 and early 2026, then fell back to pre-1980 levels in late October 2026. Technical support now sits at the October 2025 low of $45.51 per ounce, but there are no guarantees that level will hold. Volatile markets like silver often overextend on the upside during rallies, as we saw in late 2025 and early 2026, and overextend on the downside as we are now witnessing. It is virtually impossible to pick tops during bullish periods or bottoms during bearish ones. Silver is a falling knife in mid-November 2026.
Gold is for investing; silver is for trading
Gold's historical volatility is half that of silver. Given silver’s penchant for extreme volatility, Silver is a market for trading, not investing. Gold is a market for investing, not for trading.
Expect surprises in silver, and you will not be disappointed. Sentiment turned bearish in late October 2026, but it is fickle and could shift to bullish if the crowd decides that the selloff since the late January high is overdone.
On the date of publication, Andrew Hecht did not directly have a position in any of the securities mentioned in this article. All information and data in this article is solely for informational purposes. For more information please view the Barchart Disclosure Policy here.