


EN
Where Is the Next Support Level for Gold?
I asked why gold has been stuck in neutral in an October 2, 2026, Barchart article, where I concluded with the following:
Gold is stuck in neutral in October 2026. Bullish and bearish factors are pulling the precious metal in opposite directions. With critical long-term technical support at half the current price, the potential for wide price swings is high. If gold’s price falls, I would view the weakness as an opportunity to accumulate the world’s oldest asset, but leave plenty of room to accumulate, as it is virtually impossible to pick price bottoms in markets, and gold is no exception.
Nearby gold futures settled at $4,202.30 on October 1, and were nearly $450 lower in November. The COMEX gold futures are searching for technical support, but continue to make lower lows in late 2026.
Gold falls below the June 30 low
Gold has made lower highs and lower lows since late January 2026. Gold has dropped 33.5% from the January 29 high of $5,626.80 to the latest low of $3,744.60 on November 18. Gold fell below the June 30 low of $3,955.40 per ounce on October 30, 2026, and the bearish trend in 2026 remains intact.
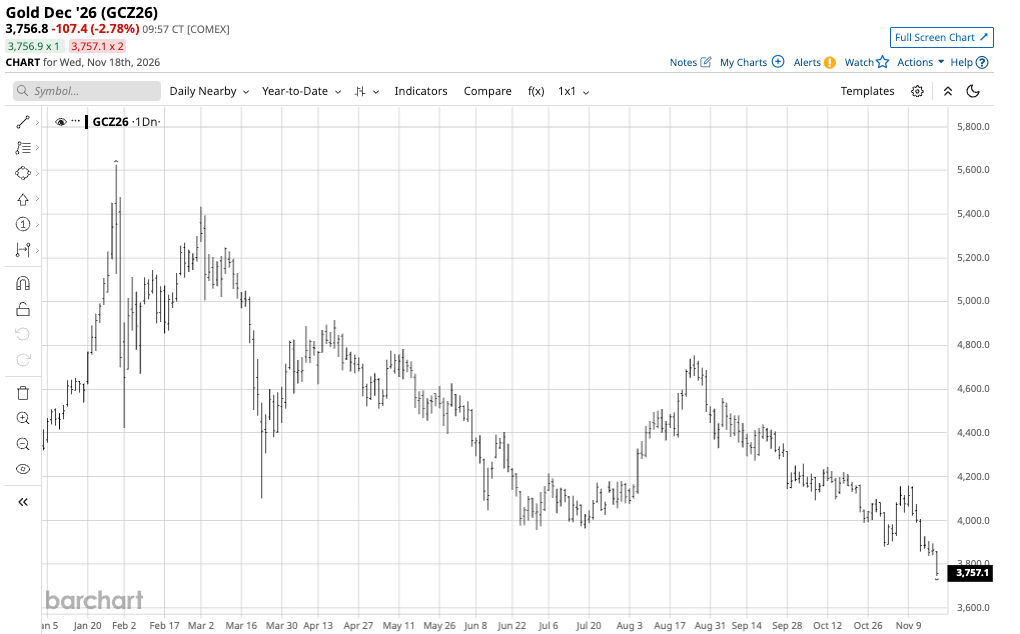
The year-to-date continuous COMEX gold futures chart shows price action remains bearish as the leading precious metal continues to make lower lows and search for a bottom.
High interest rates and a stronger dollar have weighed on gold
The U.S. dollar is the world’s reserve currency and the pricing mechanism for gold. While London is the hub of the international gold market, gold is priced in U.S. dollars, not British pounds. A weaker dollar tends to support gold as it makes it more attractive to countries with different currencies. A rising dollar often weighs on gold as it makes the precious metal more expensive in other currencies.
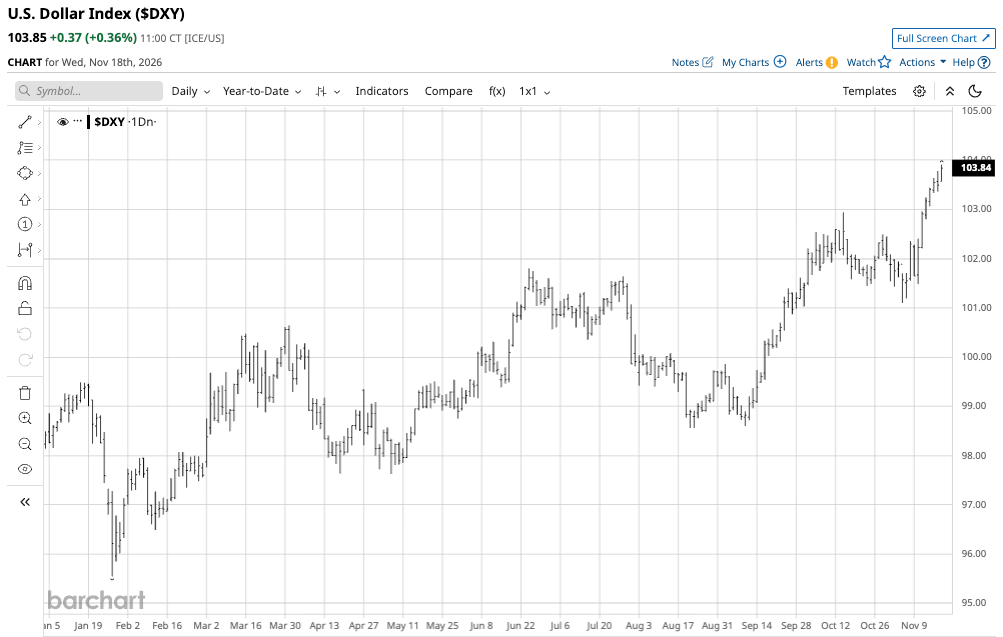
The daily chart of the U.S. dollar index shows it reached its 2026 low in late January, when gold was at an all-time high. The index has made higher lows and higher highs throughout 2026; gold has made lower highs and lower lows, as the historical correlation between gold and the dollar has held in 2026.
Meanwhile, another factor weighing on gold has been rising U.S. interest rates. Higher rates increase the cost of carrying gold inventories. Moreover, as gold competes with other assets for capital, rising rates for fixed-income assets make bonds more attractive than gold and other investment options.
In 2026, inflation above its 2% target has caused the U.S. Federal Reserve to increase the short-term Fed Funds Rate by 25 basis points for the first time since 2023. The central bank projects further Fed Funds Rate hikes in the coming months because of elevated, stubborn inflation.
While the Fed controls short-term interest rates as its monetary policy tool, long-term interest rates reflect market sentiment.
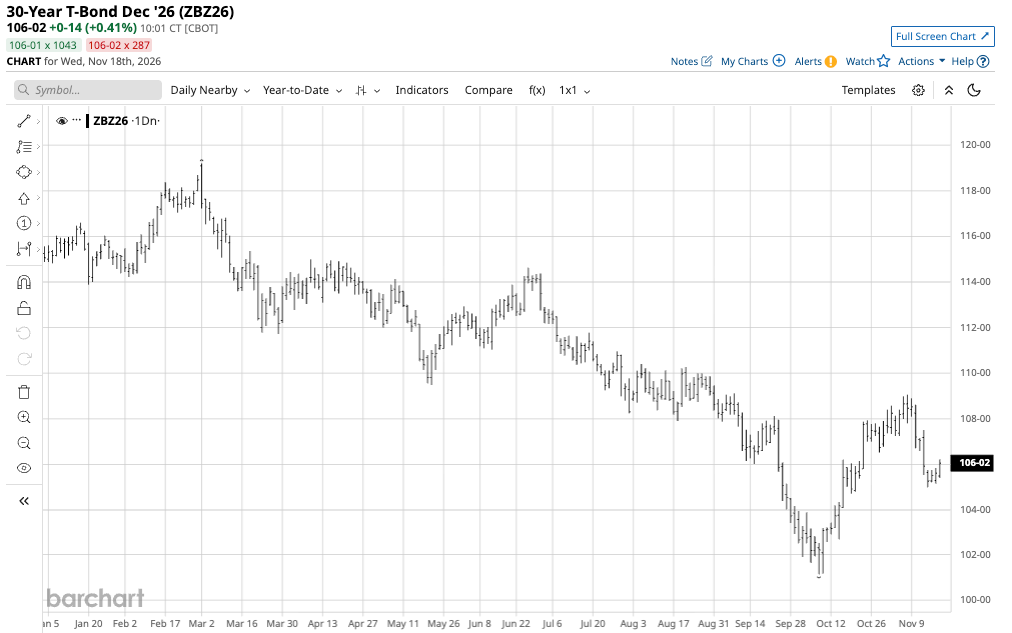
The daily chart of U.S. 30-year Treasury bond futures shows a bearish trend in long-bond futures, pushing long-term interest rates to their highest level since 2002.
A stronger dollar and rising interest rates have been a toxic bearish factor for gold prices.
Russia has sold gold, but China keeps buying
China and Russia are the world’s leading gold producers.
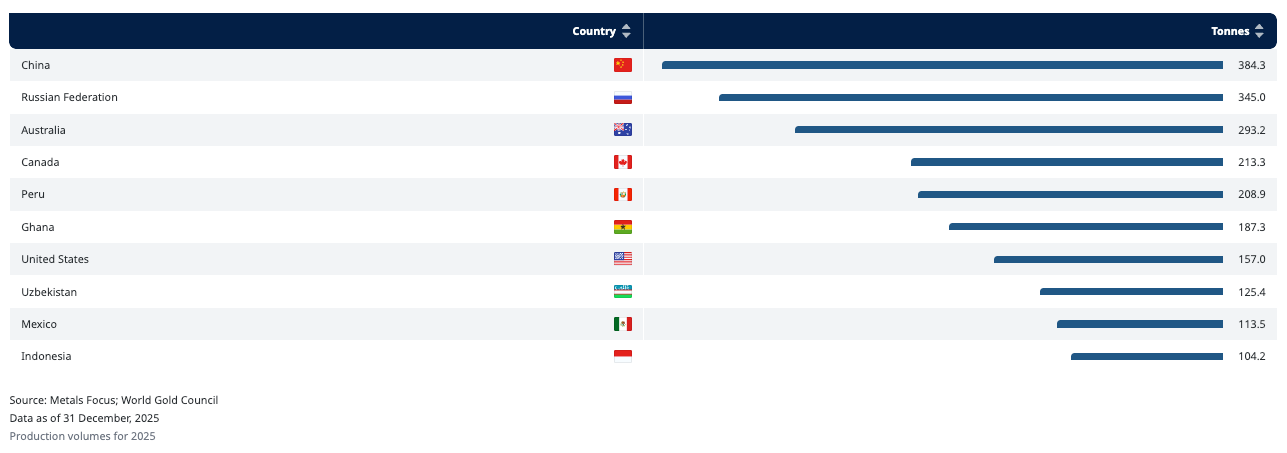
The chart shows that Chinese and Russian mine output led the world in 2025. Meanwhile, central banks, governments, monetary authorities, and supranational institutions continued to increase their gold reserves, accumulating gold in 2026. While central banks have been net buyers, Russia has sold gold as it continues to finance its ongoing war with Ukraine. Sanctions and trade barriers have forced Russia to sell gold in 2026. However, the world’s leading producer, China, has bought gold to add to its growing reserves.
Meanwhile, official statistics showing Chinese buying and Russian selling could mask overall accumulation. China and Russia consider gold holdings and government accumulation state secrets and national security matters. Therefore, it is possible that the leading gold-producing countries are vacuuming in domestic mine output that flies below the radar.
Geopolitics and economics underpin gold
Gold has a long history as a flight-to-safety asset. Wars, sanctions, trade policies, and other geopolitical turmoil tend to support gold prices. In 2026, ongoing conflicts between Russia/Ukraine, the U.S./Iran, Iran and its proxies versus neighbors in the Middle East, the bifurcation of the world’s nuclear powers, civil unrest in Europe, and other global issues are bullish for gold.
While U.S. interest rates have risen, the reasons are not bearish for gold. U.S. debt is over $40.6 trillion and growing, declining faith and credit in the U.S. dollar and all fiat currencies, stubborn inflation, and a host of other economic challenges support and underpin gold prices in 2026.
The long-term trend remains firmly intact
While gold’s trend in 2026 is clearly bearish and the streak of ten consecutive new quarterly record high prices ended in Q2 2026, gold’s long-term trend remains bullish and intact in November 2026.
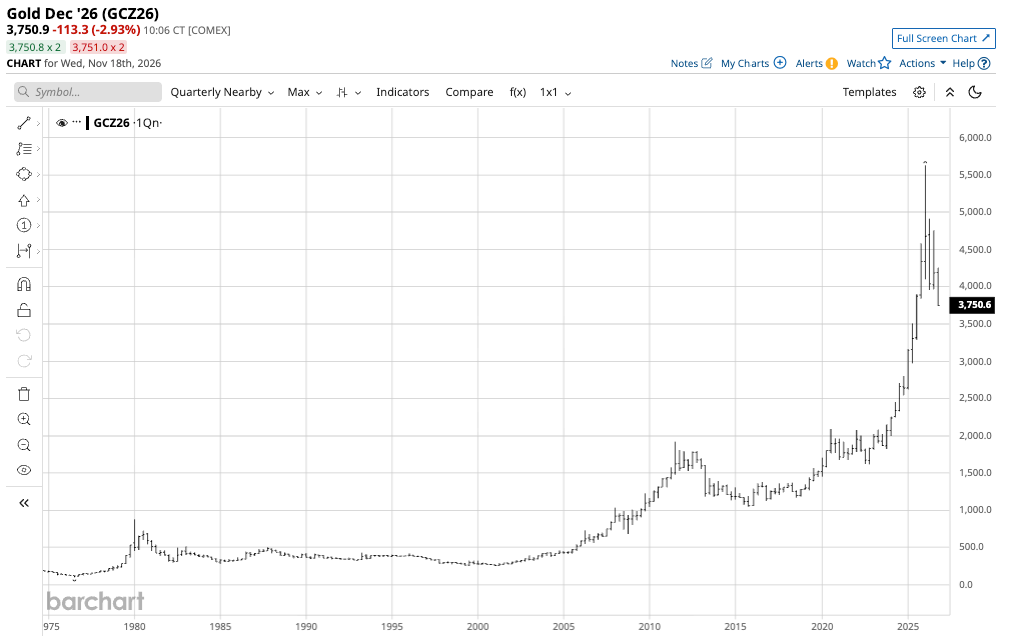
The quarterly chart dating back to the mid-1970s shows that after reaching a low of $252.80 in Q3 1999, gold has made higher lows and higher highs. Gold eclipsed the 1980 high of $875 per ounce in Q1 2008. Gold has not traded below $1,000 per ounce since Q4 2009, below $2,000 per ounce since Q4 2023, and under $3,000 per ounce since Q2 2025. After reaching $5,626.80 in Q1 2026 and correcting, gold remains around $3,750 per ounce on November 18, 2026. Based on the long-term trend, gold can fall to $2,089.20 per ounce, the Q3 2020 high, before the long-term bullish trend falters.
Gold did not hold above its first technical support level at the June 30, 2026, low of $3,955.40 per ounce, but it would have to fall by another $1,655.40 from the November 18 low to negate the bullish trend since 1999. Gold is likely to reach another higher low during the current bearish price action, which means accumulating gold on price weakness should remain optimal.
On the date of publication, Andrew Hecht did not directly have a position in any of the securities mentioned in this article. All information and data in this article is solely for informational purposes. For more information please view the Barchart Disclosure Policy here.