


EN
Here’s How Pan American Silver (PAAS) Stock Can Generate a 233% Payout
Pan American Silver (PAAS) ranks among the worst year-to-date losers, raising an obvious question: why would options traders risk their capital on PAAS stock? The inquiry becomes even more pressing when we consider the fundamental pressures.
After all, Pan American Silver stock didn’t just tumble randomly. No, there appear to be clear negative catalysts; mainly a downward gold production outlook combined with persistent macroeconomic headwinds (i.e. elevated Treasury yields, a strong dollar, and benchmark rate anxieties). There’s also the matter of the third-quarter revenue miss.
At the same time, it’s difficult to ignore the broader perspective that may bolster precious metal prices (and potentially the underlying mining sector). In addition, the resources that Pan American extracts contribute indirectly to the infrastructure buildout for artificial intelligence. As data centers continue to proliferate, demand for key metals should accelerate, thus providing a tailwind for PAAS stock.
Basically, then, the contrarian argument comes down to mean reversion. Yes, Pan American Silver stock is ugly, shedding nearly 20% in the trailing month. That “performance” has contributed to its Barchart Technical Opinion rating of 100% Strong Sell. But it’s also possible that with sentiment so heavily weighted toward one side of the ledger, a corrective response could materialize.
In fact, the historical data over the trailing five years indicates that whenever the behavioral state of PAAS stock is tilted sharply negatively, a transition from pessimism to optimism typically occurs. Of course, this doesn’t guarantee that such a transition will appear this time around. But if we’re strictly playing the odds, we are arguably incentivized to consider a bullish position.
What Do Past Analogs Say About PAAS Stock?
In order to understand what happened in the past to better adjudicate what may happen in the future, we need to identify a searchable condition. To that end, we may convert individual share prices (which is formatted sequentially with theoretically no upper limit) into discrete quantitative categories. This way, we may create a framework for further analysis.
As of this writing, we know through observing a technical chart as weekly candlesticks, over the past 10 weeks, Pan American Silver stock has only managed to print three positive sessions. Said differently, there is a seven-to-three ratio of negative sessions to positive ones, indicating that the bears have dominant control of this market.
As with any juncture in the equities sector, there are only three basic conclusions to be drawn: PAAS stock will rise, fall or engage in sideways trading. Given the current implied volatility of around 51%, I think it’s a reasonable bet that Pan American will have a clear directional bias.
Now, to assume that PAAS stock will continue on its downward slide would suggest that there are more pieces of bad news to justify the red ink. But because so much pessimism has already been baked in, banking on more bearishness may be unnecessarily risky.
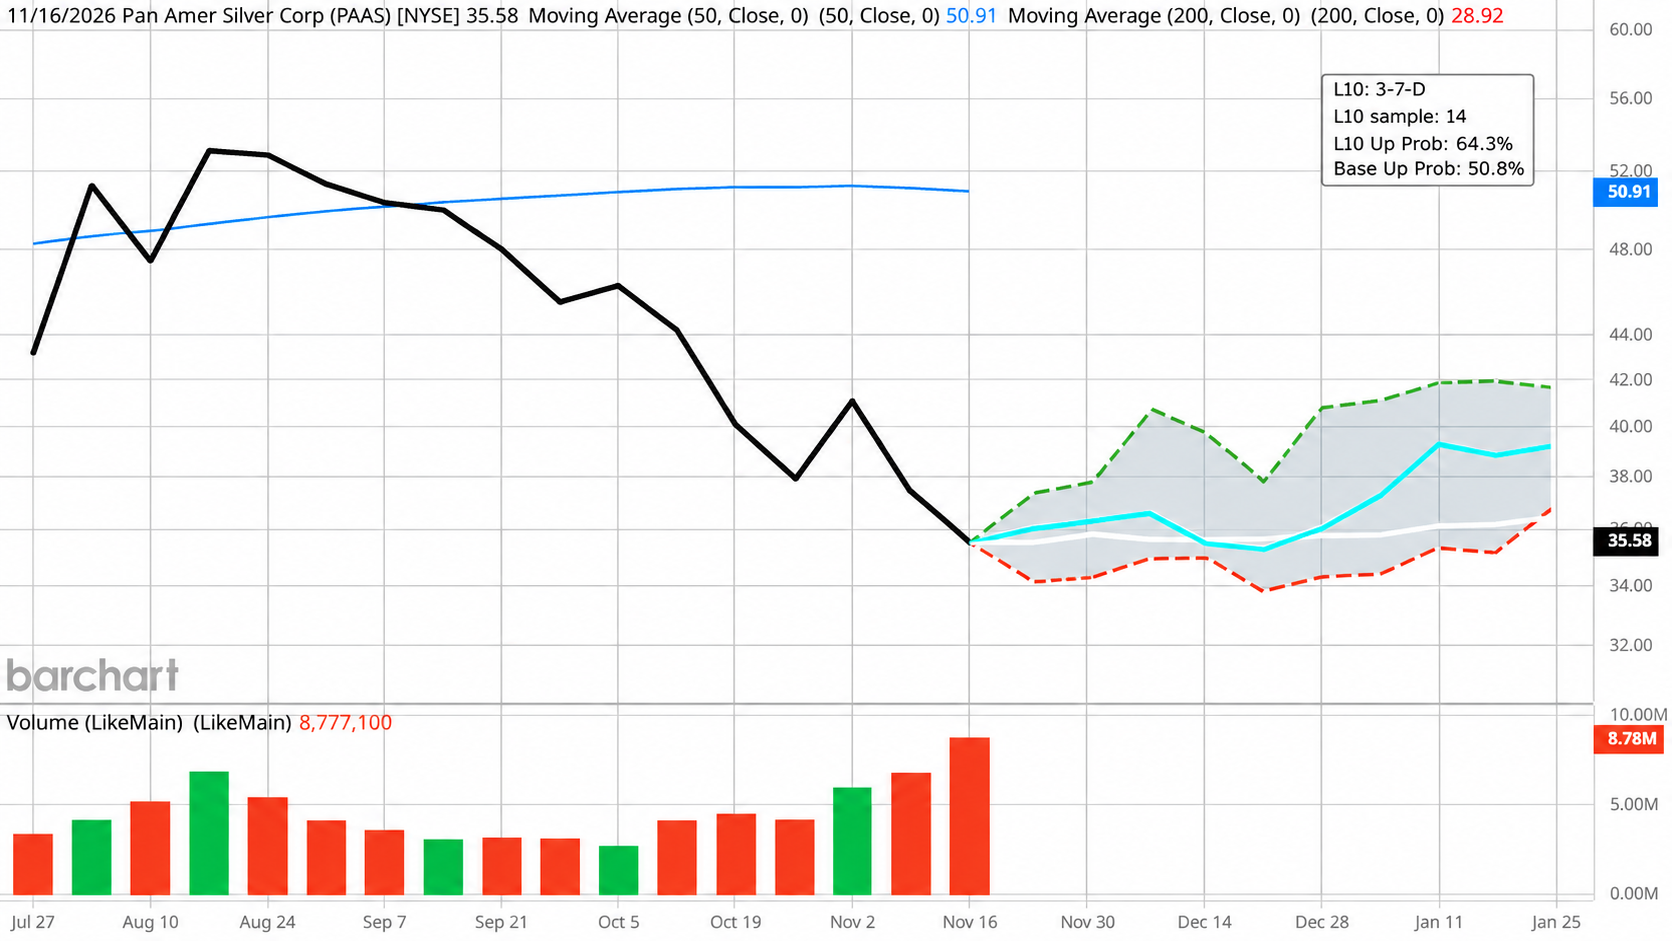
Regarding the historical data itself, we know that when the 7-to-3 ratio (negative versus positive) materializes, a bullish transition is often the result over the next 10 weeks. Using axiomatic reasoning, we may estimate that there’s a 35.7% chance that Pan American Silver stock may exceed the $42 price point on Jan. 15.
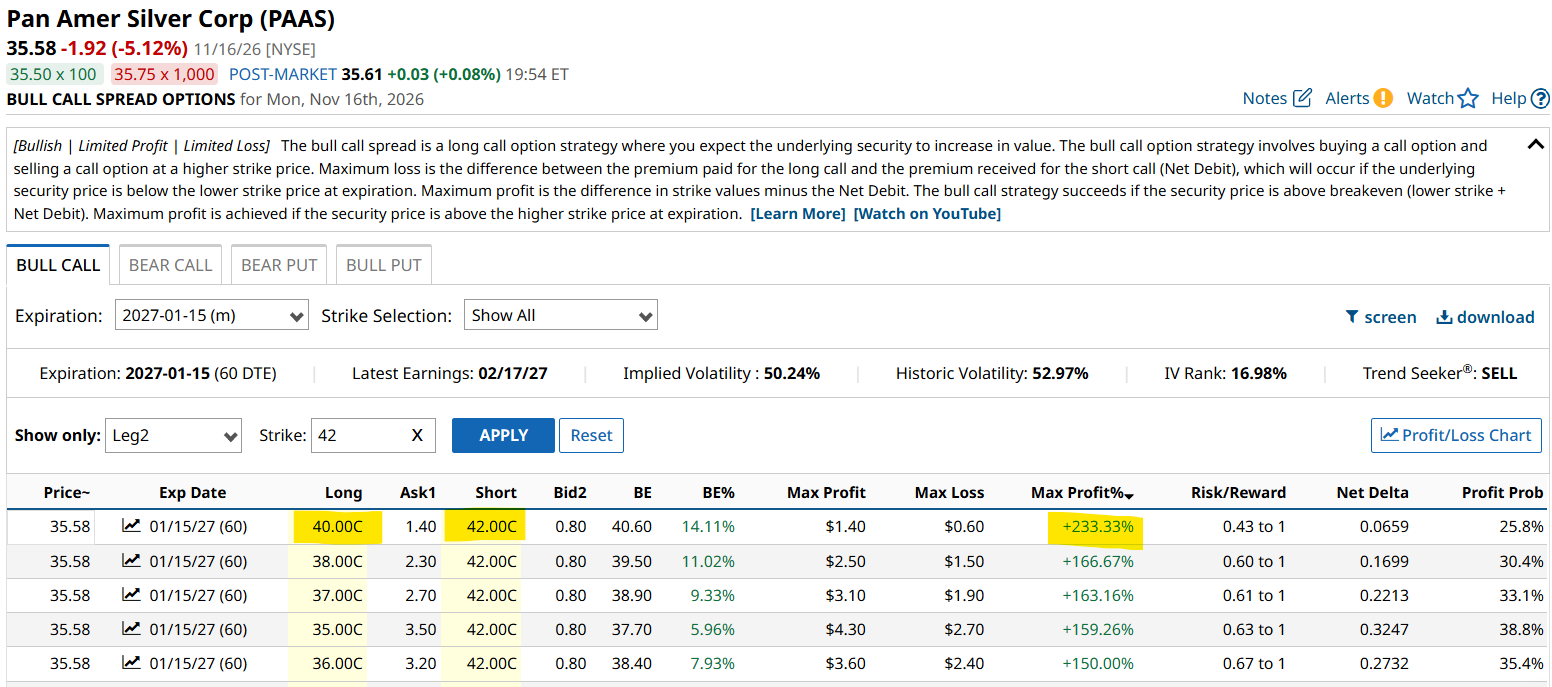
If this is accurate, the 40/42 bull call spread expiring mid-January would potentially be a compelling trading idea.
EV Calculation Adds Weight to Pan American Silver Stock
Arguably the single-most important tool in the debit-side options traders’ arsenal, the expected value calculation provides an early warning intelligence as to whether or not your proposed trade is a good deal. How so? EV forces you to realize that capital efficiency is an objective, mathematical barometer rather than an emotional one.
The bottom line is no model can possibly take into account all the external variables that may impose valuation shocks, as we all learned recently from Nvidia (NVDA). Philosophically, then, we have to assume that failure will always occur no matter what model we use. And since these failures occur way more often than we care to admit, our trading strategy must account for this reality.
To account for failure, we rely on EV by filtering for trades that feature a balanced combo of low cost, high payout and reasonable probabilities. That’s why I like the 40/42 bull spread. I’m not picking this idea “just because.” Instead, I believe it has attractive stats that ultimately lead to a positive EV.
Look at the key numbers:
- Net debit (upfront cost) of only $60.
- Maximum payout (American-style odds) of 233.33%.
- Win probability (calculated earlier) of 35.7%.
Plug these numbers into an EV calculator and you get $11.40 or a return on capital (ROC) of 19%. True, you can focus strictly on spreads that offer a much higher probability, say 65%. However, those ideas are typically very expensive and have low payouts (because it is expected that the risk taker will win). As such, those ideas have negative EV because only a few losses could potentially wipe you out.
By taking small bets, you reverse the philosophy. You anticipate losses to occur, knowing that a few big wins could make up for the total red ink and then some.
Let me be clear: the PAAS stock trade above is still very risky and there are no guarantees of success for any system. If you are going to speculate, though, you might as well do it smartly — and that’s why the January bull spread appears to make the most sense.
On the date of publication, Josh Enomoto did not directly have a position in any of the securities mentioned in this article. All information and data in this article is solely for informational purposes. For more information please view the Barchart Disclosure Policy here.