


EN
Griffon’s Q3 CY2026 sales beat estimates but full-year sales guidance misses expectations

Multi-industry consumer and professional products manufacturer Griffon Corporation (NYSE:GFF) beat Wall Street’s revenue expectations in calendar Q3 2026 [fiscal Q4 2026], but revenue fell by 25.9% year on year to $490.9 million. On the other hand, the company’s full-year revenue guidance of $1.85 billion at the midpoint came in 2.5% below analysts’ consensus estimates. Its non-GAAP profit of $1.61 per share was 1.5% above analysts’ consensus estimates.
For more on Griffon, read our free full research report.
Griffon Q3 CY2026 highlights:
- Revenue $490.9 million vs S&P analysts’ consensus estimates of $481.8 million (25.9% year-on-year decline, 1.9% beat)
- Adjusted EPS $1.61 vs S&P analysts’ consensus estimates of $1.59 (1.5% beat)
- Adjusted EBITDA $127.8 million vs analysts’ consensus estimates of $127.2 million (26% margin, in line)
- EBITDA guidance $460 million at the midpoint for fiscal 2027, below analysts’ consensus estimates of $482.6 million
- Operating margin 23.9%, up from 18.7% in the same quarter last year
- Free cash flow margin 54.4%, up from 9.3% in the same quarter last year
- Market capitalization $4.53 billion
“Fiscal 2026 was a transformational year for Griffon,” said Ronald J. Kramer, chairman and CEO of Griffon. “We completed a comprehensive series of strategic actions that repositioned Griffon into a pure play building products company, and significantly strengthened our balance sheet by extending our bond maturities to 2034 and reducing our debt by $364 million. Griffon is well-positioned for the future, and we expect our growth to accelerate as building activity improves.”
Revenue growth
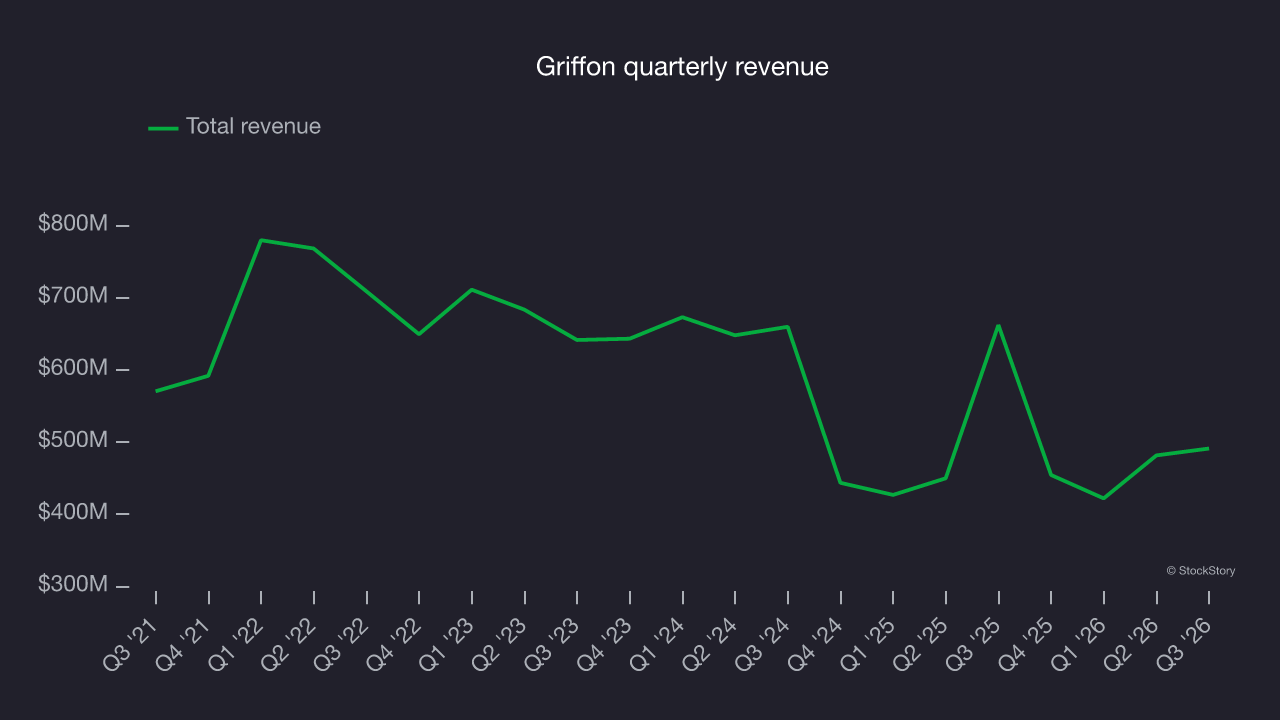
A company’s long-term performance is an indicator of its overall quality. Any business can deliver a good quarter or two, but the best consistently grow over time. Griffon struggled to consistently generate demand over the last five years as its revenue dropped at a 4% annual rate. This was an underwhelming result, but there are still things to like about Griffon.
Long-term growth is the most important, but within industrials, a half-decade historical view may miss new industry trends or demand cycles. Griffon’s recent performance shows its demand remained suppressed as its revenue has declined by 16.1% annually over the last two years. 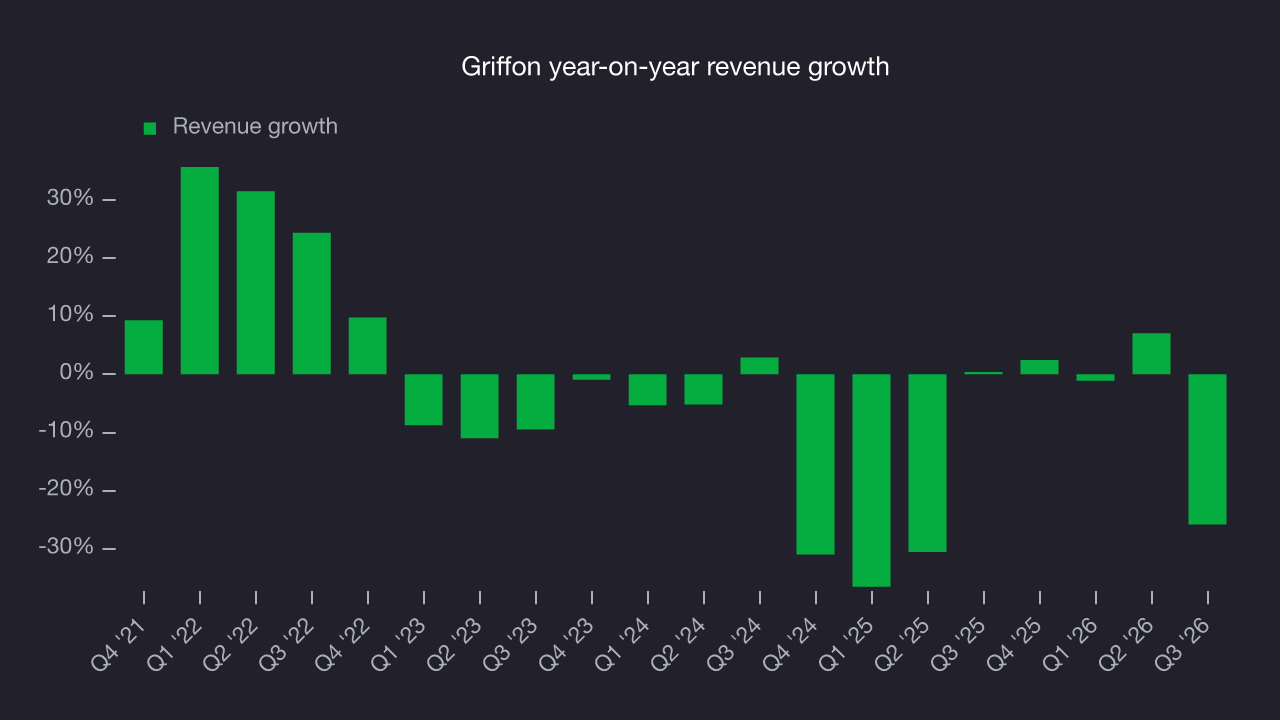
This quarter, Griffon’s revenue fell by 25.9% year on year to $490.9 million but beat Wall Street’s consensus estimates by 1.9%.
Looking ahead, sell-side analysts expect revenue to grow 2.6% over the next 12 months, according to S&P. Although this projection implies its newer products and services will support better revenue performance, it is still below the sector average. On the positive side, the company is performing well on other measures of financial health.
Operating margin
Over the last five years, Griffon’s operating margin rose by 9.6 percentage points. This improvement shows its costs declined relative to revenue. Its trailing 12-month operating margin was 22.4%.
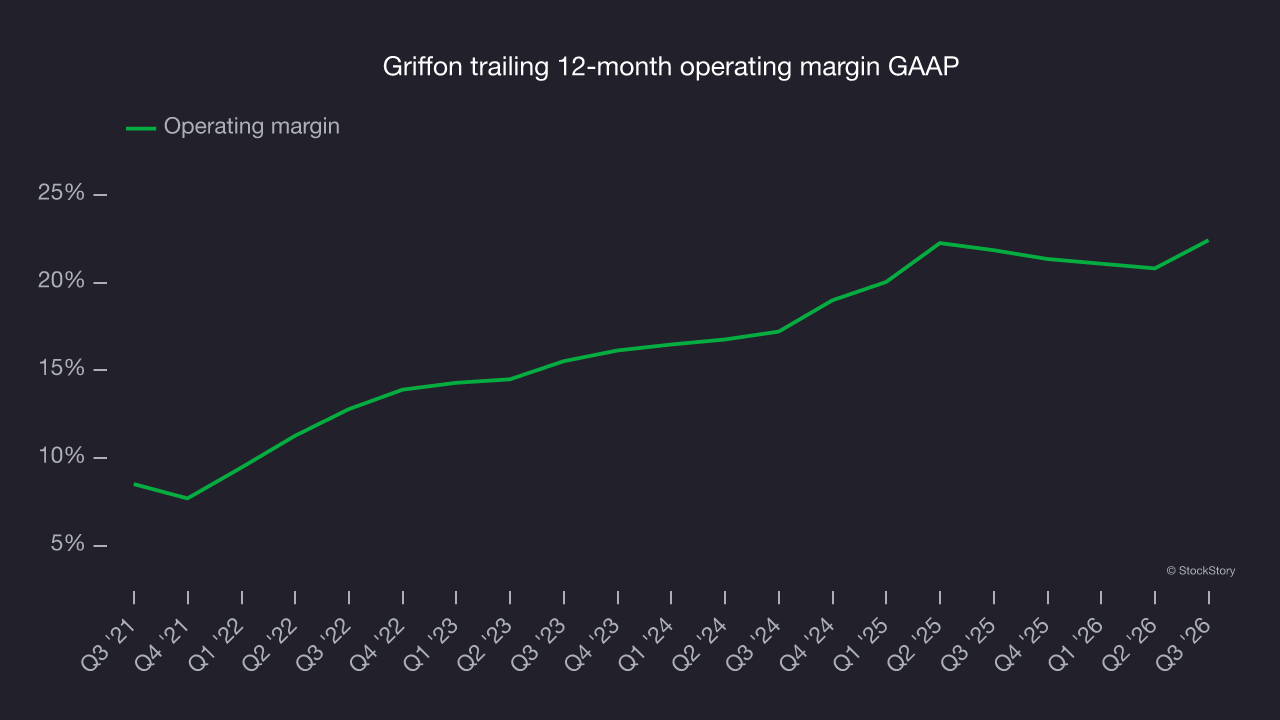
This quarter, Griffon generated an operating profit margin of 23.9%, up 5.3 percentage points year on year. The increase was solid, and its operating margin rose more than its gross margin, indicating greater efficiency in expenses such as marketing, research and development and administrative overhead.
Earnings per share
Revenue trends explain a company’s historical growth, but the long-term change in earnings per share, or EPS, points to the profitability of that growth. For example, a company could inflate its revenue through excessive spending on advertising and promotions.
Griffon’s EPS grew at a 24.6% compounded annual growth rate over the last five years, higher than its 4% annualized revenue declines. This indicates management adapted its cost structure in response to a challenging demand environment.
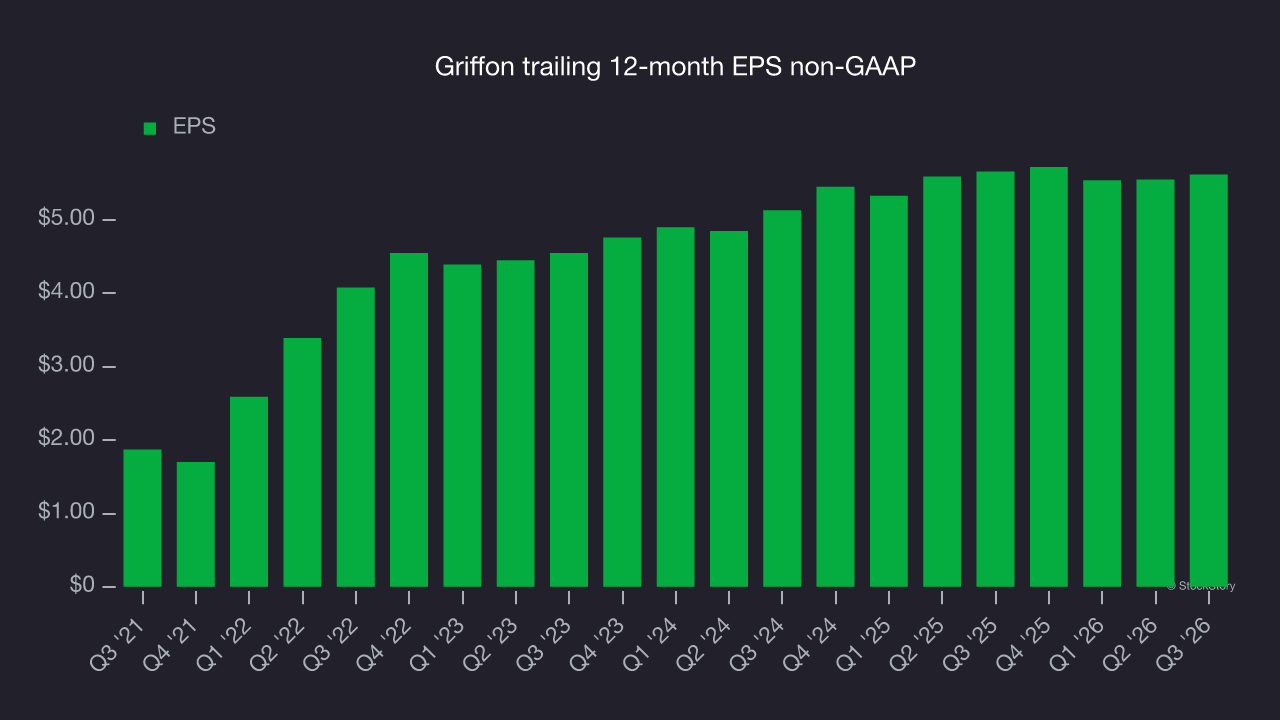
A closer look at Griffon’s earnings helps explain its performance. As noted earlier, Griffon’s operating margin expanded by 9.6 percentage points over the last five years. In addition, its share count shrank by 16.3%. These are positive signs for shareholders because improving profitability and share buybacks boost EPS growth relative to revenue growth. 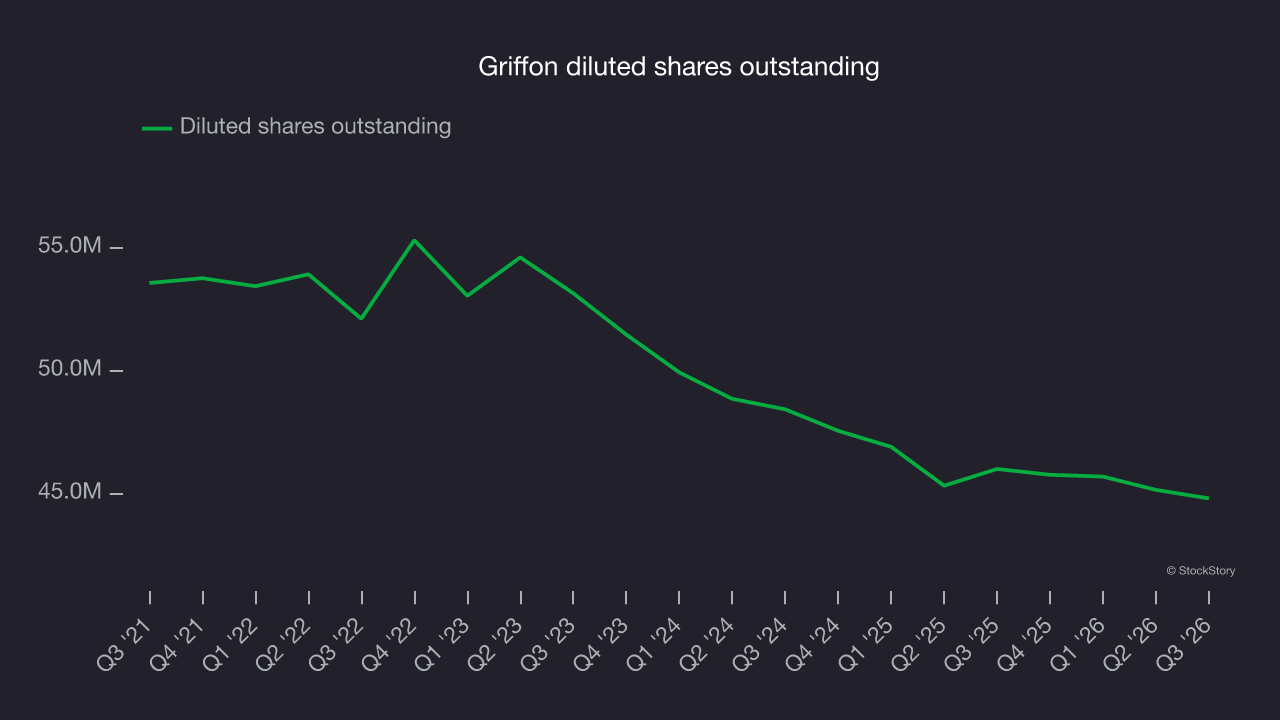
As with revenue, examining EPS over a more recent period can provide insight into an emerging theme or development for the business.
Griffon’s two-year annual EPS growth of 4.7% was lower than its five-year trend. This was underwhelming, but the company performed well on other measures of financial health.
In Q3, Griffon reported adjusted EPS of $1.61, up from $1.54 in the same quarter last year. This result beat analysts’ consensus estimates by 1.5%. Over the next 12 months, Wall Street expects Griffon’s full-year EPS to grow 8.5% from $5.62 to $6.10, according to S&P.
Key takeaways from Griffon’s Q3 results
Griffon’s revenue beat analysts’ consensus estimates, but its full-year outlook was softer: EBITDA guidance missed expectations and revenue guidance fell short of Wall Street’s consensus. Those shortfalls made for a softer quarter overall despite the revenue beat. Shares remained flat at $100.10 immediately after the release.
Griffon’s latest quarter matters when deciding whether to buy the stock, but longer-term fundamentals and valuation matter much more. Read the full research report here (it’s free).