


EN
The rebound of the Philadelphia Semiconductor Index “came to an end”: the technical side is in jeopardy. Nvidia (NVDA.US) earnings report may be the last straw?
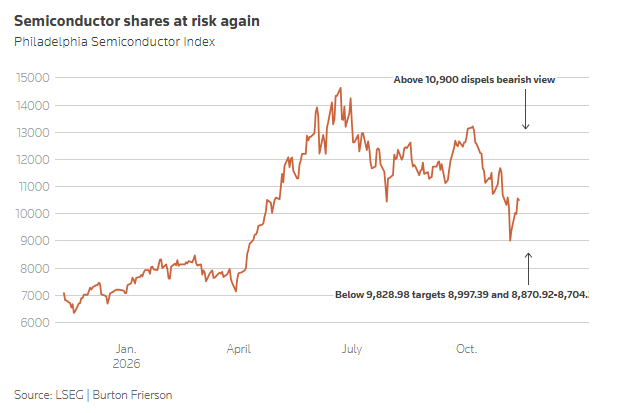
The Zhitong Finance App learned that according to the latest technical signals, the semiconductor sector, measured by the PHLX Semiconductor Index (PHLX Semiconductor Index, hereinafter referred to as SOX), has been struggling for a long time since it hit a historical closing high on June 22. Last week, SOX once staged a sharp counterattack — a cumulative rebound of more than 19% in the week ending Wednesday, once approaching 10,787.06 points. However, in the end, this highly anticipated recovery came to an abrupt end at a critical moment, like several previous attempts. The index made a U-turn downward at the end of last week and closed at 10146.32 points on Friday, once again regaining most of its gains.
For traders who keep an eye on the charts, last week's failure was no accident. The 10787.06 point position is stuck under the “ceiling” of two key resistances: the 200-day moving average — a medium- to long-term trend indicator that is widely tracked by the market; the other is the 50% Fibonacci retracement level corresponding to the March to June upward wave. When resistance and support are “superimposed” in this way, chart analysts will be extra wary. In their eyes, the market “not moving forward” in the face of such a dense group of resistance is itself a sign that the direction is about to change.
To understand the fragility of the semiconductor sector's current situation, we must go back to the basic language of technical analysis.
The so-called support and resistance are essentially a set of mutually converted price coordinates. Resistance is like a ceiling, blocking a further upward trend in prices; support is like a floor, providing a potential buffer for falling prices. These coordinates come from a variety of sources: moving averages (revealing potential trends by smoothing price extremes), Fibonacci retracement levels (calculated as percentages, the level the market often steps back on after rising or falling), and price jump gaps (formed when prices move drastically, leaving an untraded blank area on the chart). When these different technical indicators point to similar price ranges, their reference significance is greatly amplified.
Now, SOX is facing exactly this kind of picture that supports “layers of fortification, yet it is also breaking down layer by layer”.
Chart analysis indicates that after closing at 10146.32 points on Friday, SOX is approaching support around 9976 points — this is the 61.8% Fibonacci retracement level that rose from March to June, and is also the most far-reaching “golden split” level in technical analysis. Once the index falls below Friday's intraday low of 9828.98 points, the market will set its sights on two key coordinates further down: the November 5 low of 8997.39 points, and the 8870.92 to 8704.36 point range formed by 76.4% and 78.6% Fibonacci levels.
Under this range, effective support will become more and more sparse. Until the high of 8,498 points at the end of February, the index was almost in a “technical vacuum” zone. Meanwhile, the large upward jump gap left on April 8 — a gap that needs to drop to 8006 points to be fully compensated — could become a downward “gravitational point.” Under extreme circumstances, if the index falls all the way back to a low of 7084 points on March 30, this will mean that SOX has accumulated a cumulative retracement of about 52% from its historical closing high, which is almost at a standstill.
Of course, technical analysis never promises a one-sided market. If SOX can reach 10,900 points — the upper end of the range between the 50% Fibonacci retracement level and the 200-day moving average — some of the previous bearish sentiment will dissipate. However, as of now, there is a distance between this resistance level and last week's rebound high of 10,787 points, which is clearly visible but has never been crossed.
Fundamental shock far heavier than technical
If it's just technical weakness, the semiconductor sector's narrative can still be framed as “a regular correction.” But the more critical variable is a series of profound changes taking place outside of the chart — changes that blur the line between “technical adjustments” and “trend turns” as never before.
The direct trigger for this shock was the “blue wave” set off by the US midterm elections on November 5. The Democratic Party took control of both houses of the Senate and the House of Representatives in one fell swoop, and won several key gubernatorial elections. The market's first reaction was panicking: investors feared that the new legislature and local governments would apply stricter approvals to AI data center construction facilities — involving electricity, water, and land resources — thereby slowing down the pace of overall AI computing power expansion. On the same day, SOX plummeted 12.25% in a single day, the biggest single-day decline since March 2020.
But this is only the first “policy” blow. Immediately after that, macroeconomic data put pressure on the other side: last week, data released by the US Department of Labor showed that in October, CPI rose 0.4% month-on-month, higher than market expectations of 0.3%, and core CPI rose 0.3% month-on-month, also higher than market expectations; PPI rose 6.5% year on year in October, the highest since November 2022. Federal Reserve Governor Christopher Waller (Christopher Waller) said bluntly that even if inflation cools down, the central bank should raise interest rates in December, and if the situation worsens, they should even consider raising interest rates by 50 basis points. As a result, the 10-year US Treasury yield once climbed to 5.17%. For the semiconductor sector, where valuations are highly dependent on forward cash flow, the rise in risk-free interest rates is the most direct squeeze on the valuation center.
Hwang In-hoon: From “Key People” to “Key Gaps”
However, if we talk about the most destructive variable of confidence in the semiconductor sector, it is none other than NVDA.US (NVDA.US) — and this time, the problem lies precisely with the founder of this AI leader's core asset — Hwang In-hoon himself.
The events unfolded faster than most people expected. Following repeated media disclosure of Wong In-hoon's extramarital affairs scandals, on November 8, Nvidia's board of directors initiated an independent investigation and quickly announced on November 12 that Wong In-hoon would resign as CEO, president and director, with immediate effect. On the same day, the board of directors appointed Colette Kress (Colette Kress), who has been the CFO for a long time, as interim CEO, and Harvey Jones (Harvey Jones), who has been a director since 1993, as the first chairman.
The impact of this news is self-evident for a chip empire whose founder has been in charge for 33 years and once had a market capitalization approaching 4 trillion US dollars. Nvidia's stock price plummeted more than 13% at the beginning of the session on November 12, and closed down 4.34% on the same day. In the previous two days, the company's market value had evaporated by more than $420 billion — a figure that even surpassed the overall market value of Oracle (ORCL.US).
Wall Street's institutional response showed a rare kind of “fragmentation.” Bank of America removed Nvidia, Micron (MU.US), and Fanlin Group (LRCX.US) from its “US1” preferred list on November 10, but all three maintained a “buy” rating. Stifel has drastically lowered Nvidia's price target from $315 to $205, while Baird cut its price target from $500 to $200 and downgraded it to “neutral.” Meanwhile, Evercore ISI added Nvidia to the list of AI stocks worth buying next year on the grounds that “if the leadership remains stable, the current weak trend may present an excellent opportunity”.
The root of this disagreement lies in a question that technical analysis cannot answer but is sufficient to determine the direction of the sector: when a company's moat, narrative, and even pricing logic are all deeply bound to the founder's personal authority, how should “Key Man Risk” (Key Man Risk) be priced in valuation?
A head-to-head battle between technology and fundamentals
Therefore, the day after tomorrow (after the US stock market on November 17 EST), this unresolved issue will usher in the first inspection window.
Nvidia will release financial results for the third quarter of fiscal year 2027. This is Wong In-hoon's first financial report since his resignation. It is also the first time since Nvidia went public that it was submitted on an earnings conference call without Hwang In-hoon. The company's previous guidance was: revenue of approximately US$108 billion (fluctuating 2%), and GAAP and non-GAAP gross margins were 74% (fluctuating 50 basis points up and down). The market's consensus forecast is around $109 billion, slightly higher than the median guideline — this means that a financial report that simply “meets the standards” may also be difficult to satisfy the market because consensus has been boosted.
But what's really worth paying attention to is probably not the current quarter's numbers themselves, but two more forward-looking variables. The first is guidance for the next quarter. The market's consensus on revenue for the fourth fiscal quarter has reached around US$124.7 billion. If the guidelines fall below the $120 billion level, suppressed concerns may be released centrally. Second, the speakers and wording at the conference call — in the absence of Huang Renxun, whether interim CEO Kress can stabilize military sentiment, and management's response to sensitive issues such as board investigations, CEO selection, and the Chinese market (the guidelines already “assume that no data center calculation revenue from China will be generated”) will largely determine the direction of market sentiment.