


EN
Nvidia is Extraordinarily Undervalued Ahead of its Earnings on Tuesday - Has NVDA Bottomed?
Nvidia Inc. (NVDA) reports its fiscal Q3 earnings on Tuesday, after the market closes. The CEO drama has made NVDA simply too cheap. Even if its free cash flow (FCF) margins stay flat (i.e., lower than last year), FCF should more than double next year. What's the best NVDA play?
NVDA closed down another 2% on Friday, Nov. 13, at $162.85, a 6-month and 1-year low point. That's after it peaked at $238.90 just over a month ago (Oct. 5). That's too much, as this article will show.
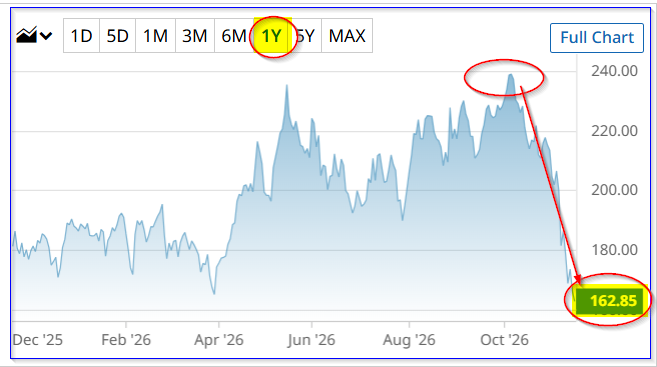
Investors must decide whether Nvidia has really lost 31.8% of its underlying value, i.e., over $1.238 trillion, in one month because of the CEO's departure. Analysts' forecasts and its strong FCF don't lead to that conclusion.
Strong FCF Forecasts and Margins
For example, analysts expect Nvidia's Q3 revenue to rise 90.7% to $108.73 billion and a similar rate this fiscal year (ending Jan. 2027) to $411.89 billion. Moreover, next year, sales are expected to rise another 67% to $688.74 billion.
In short, AI demand for Nvidia's chips won't drop 32% as the stock implies.
Moreover, last quarter Nvidia's FCF margins dipped. But even at these lower levels, its FCF should more than double. Let's see why.
In Q2, the FCF margin (i.e., FCF/revenue) was 22.24% based on Stock Analysis data, down from 28.82% a year earlier. Over the past year, its FCF margin dipped to 41.9% of revenue from 43.59% a year earlier and 47% in Q1.
However, applying this 41.9% FCF margin to next year's 67% higher sales, FCF should hit $289 billion:
$688.74 billion x 0.419 = $288.58 billion 2027 FCF
That's more than double (+227%) the $127 billion in FCF it made in the trailing 12 months as of Q2, according to Stock Analysis.
Just to be conservative, let's use a next 12-month (NTM) forecast: i.e., H2 2026 est. revenue +½ of 2027 est. revenue:
$247.54b +344.37b = $591.97 b NTM revenue
And let's say margins dip to 39% of revenue over the next 12 months:
$591.97 x 0.39 = $230.9 billion FCF NTM
That FCF estimate is still 81.8% higher than the $127 billion in the past year as of Q2. Moreover, based on the $70 billion in FCF in the first half, this $230.9 NTM estimate is still 65% higher than the run-rate H1 level (i.e., $140 billion).
The bottom line is that FCF is expected to rise dramatically. That won't leave the stock down at this level.
What's Nvidia Worth? NVDA Price Targets
Right now, Nvidia has a market cap just short of $4 trillion ($3.932 trillion), even after dropping almost 32%. That means its average over the last year has been $4.559 trillion.
As a result, its Q2 TTM FCF of $127 billion has been 2.785% of its average market cap.
But, just to be conservative, let's use a higher 3.23% FCF yield to estimate its value (i.e., $127b/ $3.932 = 0.0323) :
$230.9 billion NTM FCF / 0.0323 = $7,149 billion, i.e., $7.149 trillion
That implies that NVDA's price target (PT) is +81.8% higher (i.e., $7.149 tr / $3.932 - 1 = 1.818):
$162.85 price x 1.818 = $296.06 PT
That's close to what other analysts think. For example, Yahoo! Finance's survey of 61 shows an average PT of $283.31, and Barchart's mean survey PT is $272.78 (+67.5%). Meanwhile, AnaChart, which tracks recent analyst write-ups, shows an average of $282.32 from 38 analysts.
The bottom line is NVDA is worth 67.5% to 81.8% more than Friday's close.
However, what's the best play here? Let's look at two simple plays: selling short out-of-the-money (OTM) puts in near-term expiry periods, and buying in-the-money (ITM) calls for long-dated periods.
Shorting Near-Term OTM NVDA Puts
This play lets an investor to set a lower potential buy-in, if NVDA drops after earnings, and still collect income.
For example, the Dec. 18 expiry period, 34 days from now, shows that the $150 put strike price, which is 7.89% lower, has a midpoint premium of $5.93. That means a short seller makes a one-month yield of 3.953% (i.e., $593/$15,000 collateral).
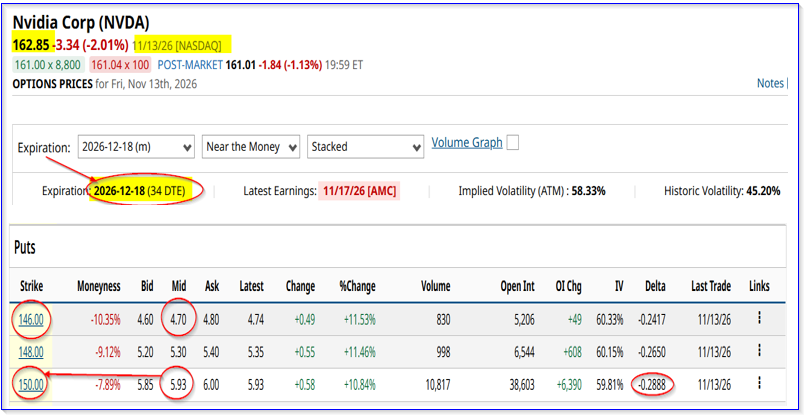
Moreover, even if NVDA drops to $150, the breakeven buy-in point is $150-$5.93, or $144.07. That's 11.5% lower than Friday's close. That doesn't seem likely to happen over the next month. For example, the delta ratio is low at -0.2888, implying a 71.1% chance that NVDA will stay over $150.00 by Dec. 18.
In addition, if the investor repeats this play over 12 months, the potential income is $71.16 ($5.93 x 23), or an expected return (ER) of 43.1% annualized.
A related play is to do a put credit spread. That entails buying a lower put strike price contract. But the collateral is much lower, so the ER is much higher, albeit with higher risk.
For example, after buying the $140 put for $470, the net credit is $123 (i.e., $593-$470). But the brokerage firm requires only $1,000 in collateral. So the net at-risk return is:
$123/($1,000-$123) = $123/$878 = 0.140= 14.0% ER
Even if the investor closes this out at 50% of that profit, the annualized expected return is 84% (7% x 12). This risk is that if NVDA drops to $148.77 (breakeven) or -8.65%, the investor begins to lose money. At $146, 100% of the $1,000 in collateral is lost (i.e., net $878).
Buying Long-Dated In-the-Money (ITM) NVDA Calls
This play provides a leveraged return play with some downside protection. For example, the Dec. 17, 2027, expiry shows that the $150.00 call strike price has a midpoint premium of just $40.30.
That means it costs only $190.30 ($150 + $40.30) to buy 100 shares, or just 16.85% above Friday's close.
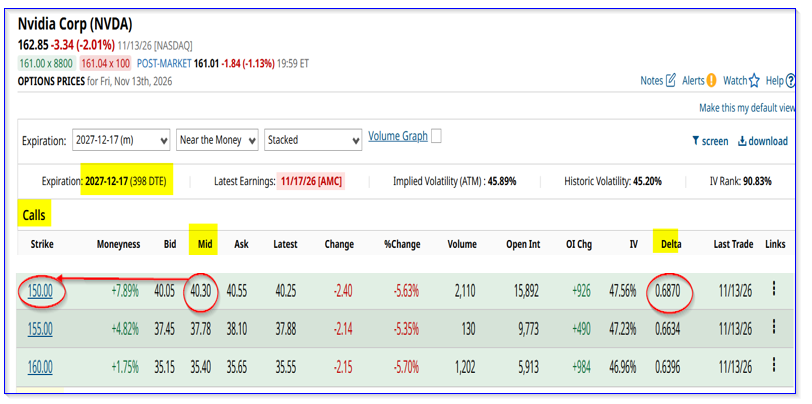
If NVDA rises to $200 per share, the calls would be worth at least $50 plus some extra extrinsic value, say $10.00. So, the expected return (ER) is $60.00/40.30, or +48.88%.
That's much better than the $200/$162.85, or +22.8% return from just owning NVDA shares.
Moreover, if an investor also shorts OTM puts every month for 7 months (i.e., $5.93 x 7 = $41.51), an investor could potentially cover the $40.30 cost of the ITM calls.
These are some ways to play NVDA, which seems deeply undervalued at Friday's close.
On the date of publication, Mark R. Hake, CFA did not directly have a position in any of the securities mentioned in this article. All information and data in this article is solely for informational purposes. For more information please view the Barchart Disclosure Policy here.