


EN
Exelon (EXC) Could Be 3% Undervalued Following New Illinois Climate Risk Study
A new climate study from Exelon (EXC) subsidiary ComEd and Argonne National Laboratory points to almost double the severe rainfall events in northern Illinois, sharpening investor focus on weather risk to Exelon’s grid.
At a share price of US$46.25, Exelon has recorded a 6.32% 1 month share price return and a 5.31% year to date share price gain. The 3 year total shareholder return of 31.74% and 5 year total shareholder return of 43.52% point to momentum that has been building over time as grid resilience, climate risk and regulated investment themes keep drawing investor attention.
Scan for other grid resilience plays benefiting from climate-focused investment themes with our curated 44 power grid technology and infrastructure stocks that echo the issues Exelon is tackling today.
Bulls point to Exelon’s climate linked investment opportunities and steady recent returns. Bears focus on regulatory and weather risk. The valuation section now needs to clarify which side current pricing appears to support.
Most Popular Narrative: 3% Undervalued
At a last close of $46.25, the analyst consensus Narrative on Simply Wall St points to Exelon trading a little below its fair value estimate of about $47.59, using a 7.42% discount rate to bring future earnings back to today.
The rebalanced US$41.7b capital plan that shifts US$1.5b into higher earning transmission while deferring US$1.1b of lower priority distribution projects positions Exelon to pursue its targeted 7.9% rate base growth, with a tilt toward assets that can support operating EPS and cash flow.
See why 39 investors see Exelon as 3% undervalued.
Result: Fair Value of $47.59 (UNDERVALUED)
Still, the Exelon story can change quickly if regulators push back harder on rate cases, or if customer affordability concerns limit the US$41.7b capital plan.
Find out about the key risks to this Exelon narrative.
Another View: P/E Signals For Exelon
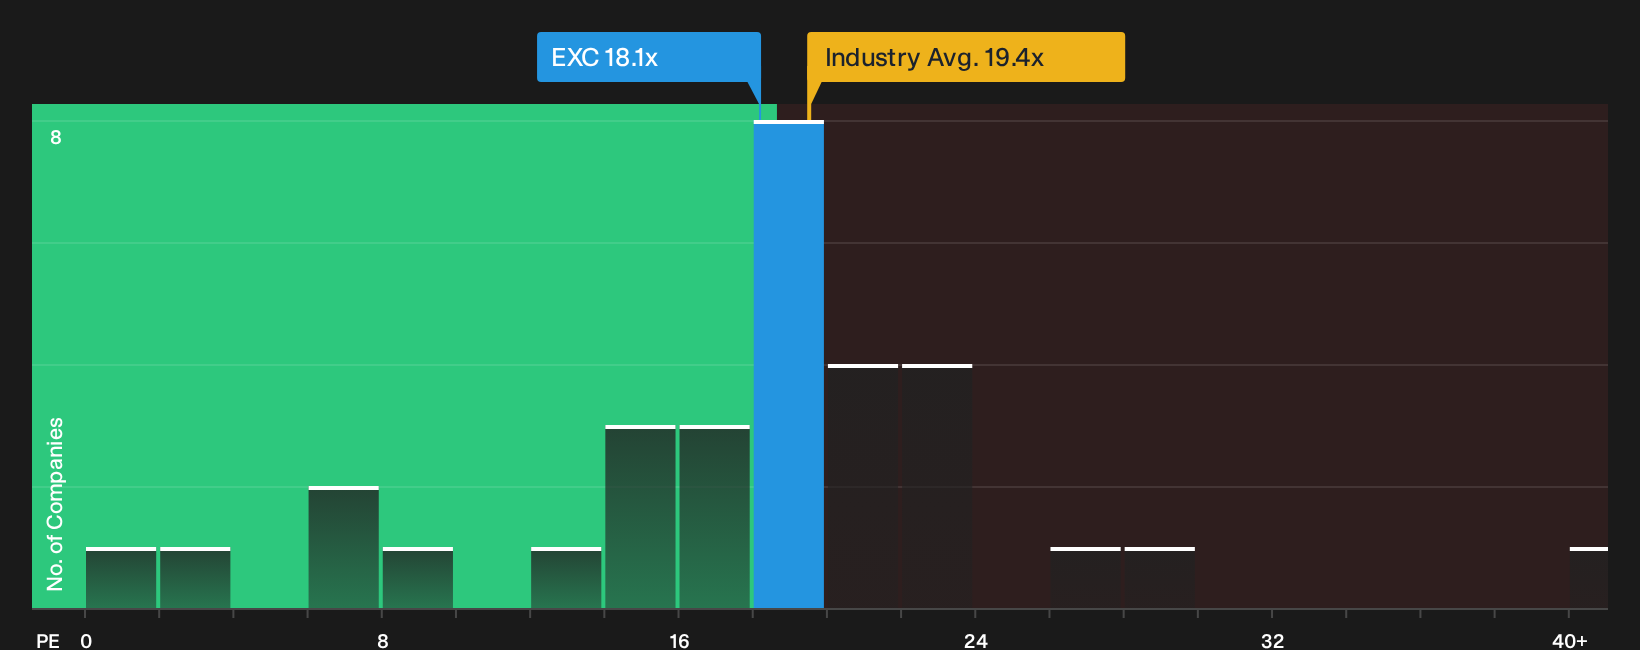
The fair value of $47.59 suggests Exelon is modestly undervalued, yet the market is also sending a milder signal through its P/E ratio. At 18.1x, the shares sit below the Electric Utilities industry on 19.4x and under a fair ratio of 22.6x. This implies investors are pricing in some risk and leaving a valuation gap that could either close or widen as the grid plan and rate cases play out.
Before leaning on that gap too heavily, it helps to see how those valuation numbers stack up in detail in our breakdown, including peer and fair ratio context, through See what the numbers say about this price — find out in our valuation breakdown..
For a quick visual sense of where Exelon trades against the sector on earnings, review the P/E comparison chart here
Simply Wall St performs a discounted cash flow (DCF) on every stock in the world every day (check out Exelon for example). We show the entire calculation in full. You can track the result in your watchlist or portfolio and be alerted when this changes, or use our stock screener to discover 34 high quality undervalued stocks. If you save a screener we even alert you when new companies match - so you never miss a potential opportunity.
Next Steps
Mixed signals on Exelon so far. If you want to act while the story is still taking shape, consider both perspectives through 3 key rewards and 2 important warning signs.
Looking for more investment ideas beyond Exelon?
Use the same toolkit that surfaces valuation gaps at Exelon to spot fresh opportunities, so your watchlist keeps working even when this story pauses.
- Target resilient cash generators by scanning our 34 high quality undervalued stocks that combine quality fundamentals with prices that still leave room for a potential upside story.
- Prioritise staying power and sleep-at-night balance sheets with a curated list of solid balance sheet and fundamentals (24 results) that filters for strength instead of short term excitement.
- Hunt for potential early stage winners using our focused 13 elite penny stocks with strong financials before attention fully shifts to the next crowded trade.
Have feedback on this article? Concerned about the content? Get in touch with us directly. Alternatively, email editorial-team@simplywallst.com