


EN
Honda Motor (TSE:7267) Issued Fresh Guidance, Is The Stock Fully Valued?
Honda Motor (TSE:7267) has put fresh numbers on the table, issuing earnings guidance for the year to March 2027 alongside half year results, while keeping its quarterly dividend unchanged.
The stock has reacted positively to the flurry of recent updates, with a 1-day share price return of 1.66% and a 90-day gain of 11.07%. The 1-year total shareholder return of 24.01% and 5-year total shareholder return of 104.02% point to momentum that has been building rather than fading.
Scan how Honda Motor’s guidance and hybrid push compares with 73 high quality undiscovered gems that have similar fundamentals and long runway potential.
Honda Motor has already rewarded patient holders, yet the latest guidance and hybrid build out still leave a gap between share price and implied value. How much of the opportunity is already in the stock, and how much remains?
Most Popular Narrative: 1.6% Overvalued
Honda Motor last closed at ¥1,841.5, slightly above the analyst consensus Narrative fair value of ¥1,812.5. The current quotation sits just above that modeled range and reflects the hybrid and motorcycle story investors are focusing on. The analyst consensus Narrative on Simply Wall St ties that fair value to specific assumptions on future earnings, margins, and discount rate rather than to a single opinion.
The restructuring of the automobile business, including the Triple Half initiative to reduce development cost, duration and man hours versus 2025 levels, along with a target of around 20% better production efficiency over five years, is aimed at building a leaner manufacturing base that can support auto operating margin improvement and more stable earnings.
See why 18 investors see Honda Motor as 2% overvalued.
Result: Fair Value of ¥1,812.5 (OVERVALUED)
Still, the narrative around Honda Motor meets real friction if EV related losses persist longer than expected or if the China slump in hybrid and ICE volumes deepens.
Find out about the key risks to this Honda Motor narrative.
Another View: Honda Motor on Simple Sales Math
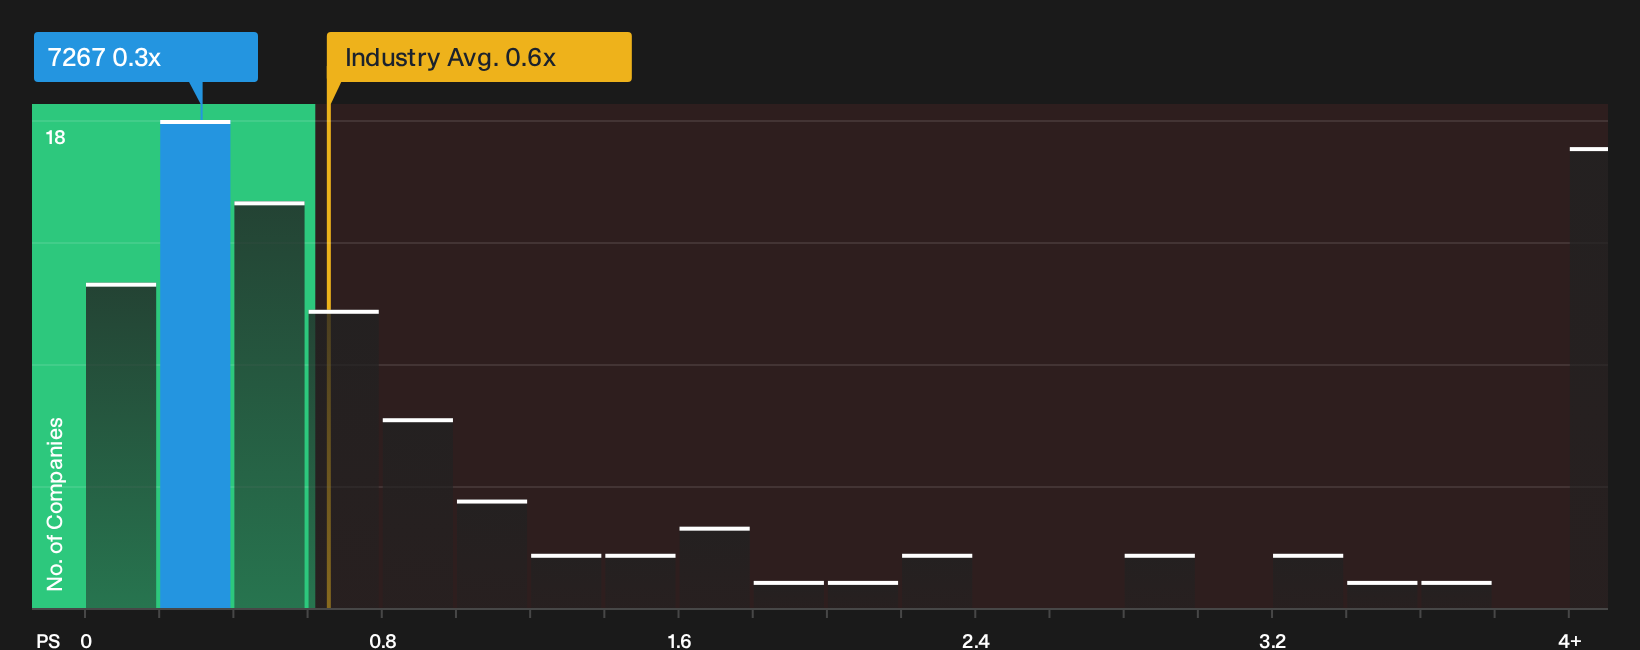
The DCF signal is not the only story. On plain P/S, Honda Motor trades at about 0.3x, compared with 0.5x for close peers and 0.6x for the wider Asian auto group, while the fair ratio sits near 0.8x. That kind of gap can point to either a valuation cushion or lingering concern. Which side do you think it is?
See what the numbers say in context with our valuation breakdown, then compare Honda Motor against other stocks using the same ratio framework. See what the numbers say about this price — find out in our valuation breakdown.
Next Steps
If the mixed signals around Honda Motor leave you on the fence, use that tension as a prompt to test the data yourself. Weigh the upside and the downside in your own framework, then ground your view in the 3 key rewards and 2 important warning signs.
Looking for more investment ideas beyond Honda Motor?
If Honda Motor has you thinking harder about opportunity and risk, do not stop there. Put the same scrutiny to work across a wider watchlist.
- Target resilient compounding potential by checking companies that screen well on value and quality factors through the 20 high quality undervalued stocks.
- Prioritize sleep-at-night resilience by reviewing stocks with sturdy finances and healthy fundamentals sourced from the list of solid balance sheet and fundamentals (24 results).
- Hunt for future market stories early by scanning high quality prospects that still fly under the radar using the 73 high quality undiscovered gems.
Have feedback on this article? Concerned about the content? Get in touch with us directly. Alternatively, email editorial-team@simplywallst.com