


EN
Veidekke (OB:VEI) Posted Strong Q3 Growth, Is The Premium Already Priced In?
Veidekke (OB:VEI) just posted third quarter 2026 results that put fresh numbers around the stock’s recent move, with both sales and net income higher than a year earlier.
That earnings beat comes on top of a strong run for Veidekke, with the share price up 2.65% on the day, a 30 day share price return of 14.29%, and a 1 year total shareholder return of 52.18%, which points to momentum that has been building rather than fading.
Scan how Veidekke’s post-earnings momentum compares with other construction and infrastructure contractors by reviewing our hand picked list of list of solid balance sheet and fundamentals (200 results)
Veidekke now has earnings momentum and a strong construction backlog on the table, yet the share price has already sprinted ahead. Are you paying too much for that quality, or still getting a fair deal?
Price-to-Earnings of 17.2x: Is it justified for Veidekke?
Veidekke now trades on a P/E of 17.2x, which places the NOK232 share price above several valuation benchmarks and suggests investors are paying a premium versus peers.
The P/E ratio links what you pay today to the company’s current earnings power. For a contractor like Veidekke, that metric helps you judge how much the market is willing to pay for each krone of profit from construction projects and infrastructure work.
Veidekke is flagged as expensive on this yardstick. The current 17.2x P/E sits higher than the European Construction industry average of 15.7x, and it also exceeds the peer group average of 16.1x. The stock is described as expensive relative to an estimated fair P/E of 16x, which is a level the market could move towards if enthusiasm cools or earnings do not keep pace with expectations.
Explore the SWS fair ratio for Veidekke.
Result: Price-to-Earnings of 17.2x (OVERVALUED)
Still, the Veidekke story can change quickly if the construction backlog weakens or if sentiment turns against stocks trading above analyst targets.
Find out about the key risks to this Veidekke narrative.
Another View on Veidekke’s NOK232 Share Price
There is a different lens you can use here. Our DCF model estimates Veidekke’s future cash flow value at NOK175.21 per share, which points to the stock trading above that level. That gap suggests less room for error if growth or margins soften.
To see how that cash flow view is built line by line, take a look at the Look into how the SWS DCF model arrives at its fair value.
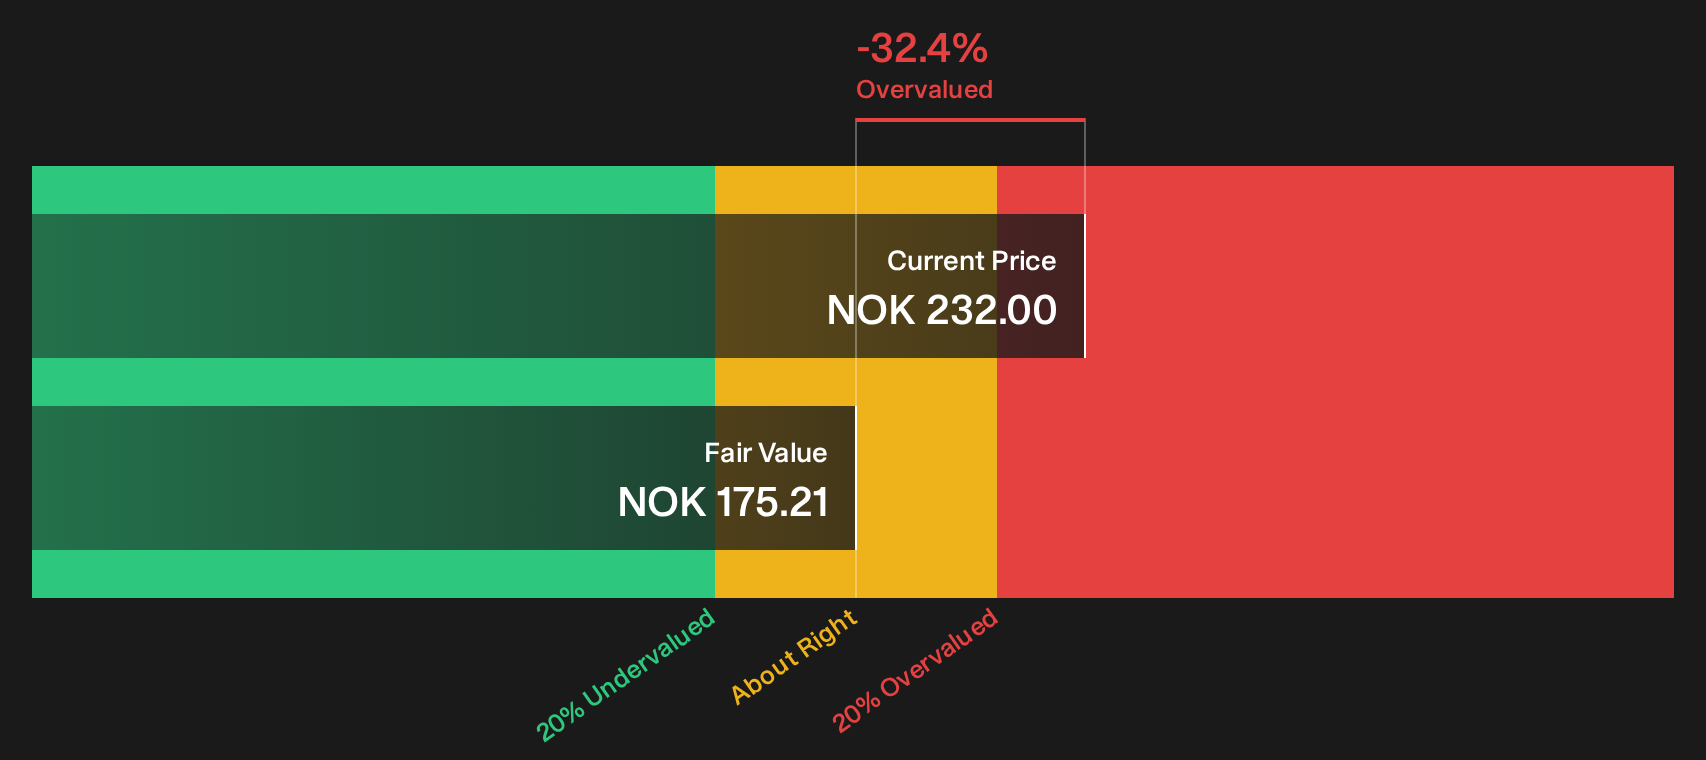
Simply Wall St performs a discounted cash flow (DCF) on every stock in the world every day (check out Veidekke for example). We show the entire calculation in full. You can track the result in your watchlist or portfolio and be alerted when this changes, or use our stock screener to discover 199 high quality undervalued stocks. If you save a screener we even alert you when new companies match - so you never miss a potential opportunity.
Next Steps
Momentum around Veidekke is clear, but the debate now is whether the current price fully reflects both the upside and the risks. If you want to stress test your own view quickly, weigh up the 2 key rewards and 1 important warning sign.
Looking for more investment ideas beyond Veidekke?
If Veidekke has sharpened your thinking about price, quality and risk, do not stop here. Use the same discipline to cast a wider net across the market.
- Target resilient balance sheets by scanning companies with steady fundamentals using the list of solid balance sheet and fundamentals (200 results).
- Hunt for mispriced quality by filtering for 199 high quality undervalued stocks that might align better with your return and risk expectations.
- Prioritise consistency and income potential by reviewing a focused group of 218 dividend fortresses that could complement a total return approach.
Have feedback on this article? Concerned about the content? Get in touch with us directly. Alternatively, email editorial-team@simplywallst.com