


EN
Silver Slips Toward Major Support as Yields and the Dollar Climb
Key Levels to Watch
- Spot silver: the next downside objectives are $46.48 and the October 28, 2025 main bottom at $45.55.
- December Comex silver: last at $48.650, below its 8 EMA at $48.701, 21 EMA at $48.889 and anchored VWAP at $51.738. Support is the recent low near $48.54, and the main trend turns up only above the $53.78 swing top.
- Pressure points: rising Treasury yields and a strengthening U.S. dollar.
Friday’s Selloff
Silver ended Friday lower after sellers pushed both spot and Comex prices through their latest bottoms. That break sets up a test of some important longer-term technical levels.
Spot silver (XAGUSD) closed at $48.74. December Comex silver was at $48.650 in the 3:45 PM bar on Friday.
Three forces drove the weakness: higher Treasury yields, a firmer U.S. dollar and strong expectations for a Fed rate hike.
Inflation and the Fed
The Bureau of Labor Statistics reported that producer prices rose 0.3% in October, below economists’ forecasts. The annual rate still climbed to 6.5% from 6.3% in September. Silver’s reaction suggests traders gave the softer monthly reading little weight.
In my view, the monthly figure was not weak enough to alter the Fed’s thinking after Tuesday’s hot CPI report. The larger question for silver is how high the Fed will lift rates and how long it will hold them there.
Dollar and Yields
The U.S. Dollar Index has cleared its recent swing top at 102.945 and is moving toward the longer-term top at 103.540. With the uptrend intact, silver buyers face another headwind.
I’m watching the dollar’s reaction at 103.540. A breakout above that level could add pressure on silver. If the dollar stalls, silver may find some relief, but I would want to see more than a single pause before expecting a lasting recovery.
The 10-year Treasury yield jumped to 5.172% on Friday before easing back below the upper end of its retracement zone at 5.155%. A sustained move above 5.155% could fuel another leg higher in the dollar, leaving silver under the same strain it felt this week. Lower yields, on the other hand, could draw in counter-trend buyers.
Technical Outlook: Spot Silver
The daily swing chart shows a main downtrend, which was reaffirmed Friday when sellers took out the previous main bottom at $48.62. A move through $53.73 would turn the main trend up.
Spot silver is now trading within the 50% to 61.8% retracement zone of its all-time high at $121.67. That zone runs from $60.835 down to $46.48. Beneath it lies the October 28, 2025 main bottom at $45.55. If that level fails, prices could fall toward the September 17, 2025 main bottom at $41.14.
My bias is to the downside, and I will stay bearish as long as the 2-day swing chart keeps printing lower tops and lower bottoms. I expect selling to resume next week on a break below Friday’s low at $48.49, with the all-time 61.8% level at $46.48 and the $45.55 main bottom as the next targets.
For Monday, November 16, the December silver pivot levels are: R3 upper target at $50.465, R2 breakout zone at $49.835 and R1 initial resistance at $49.450 above the market; S1 initial support at $48.690, S2 breakout zone at $48.305 and S3 lower target at $47.675 below it. With Friday’s last price at $48.650 already under S1, that level acts as first resistance on Monday, and S2 at $48.305 is the nearest support.
| Level | Label | Price |
|---|---|---|
| R3 | Upper Target | $50.465 |
| R2 | Breakout Zone (Upside) | $49.835 |
| R1 | Initial Resistance | $49.450 |
| S1 | Initial Support | $48.690 |
| S2 | Breakout Zone (Downside) | $48.305 |
| S3 | Lower Target | $47.675 |
Technical Outlook: December Comex Silver Futures
December Comex silver is in a downtrend on the chart. After peaking near $53.78, it dipped to about $51.35, bounced to a lower top near $53.10 and then stepped steadily lower to about $48.54. My outlook stays bearish while the contract keeps making lower tops.
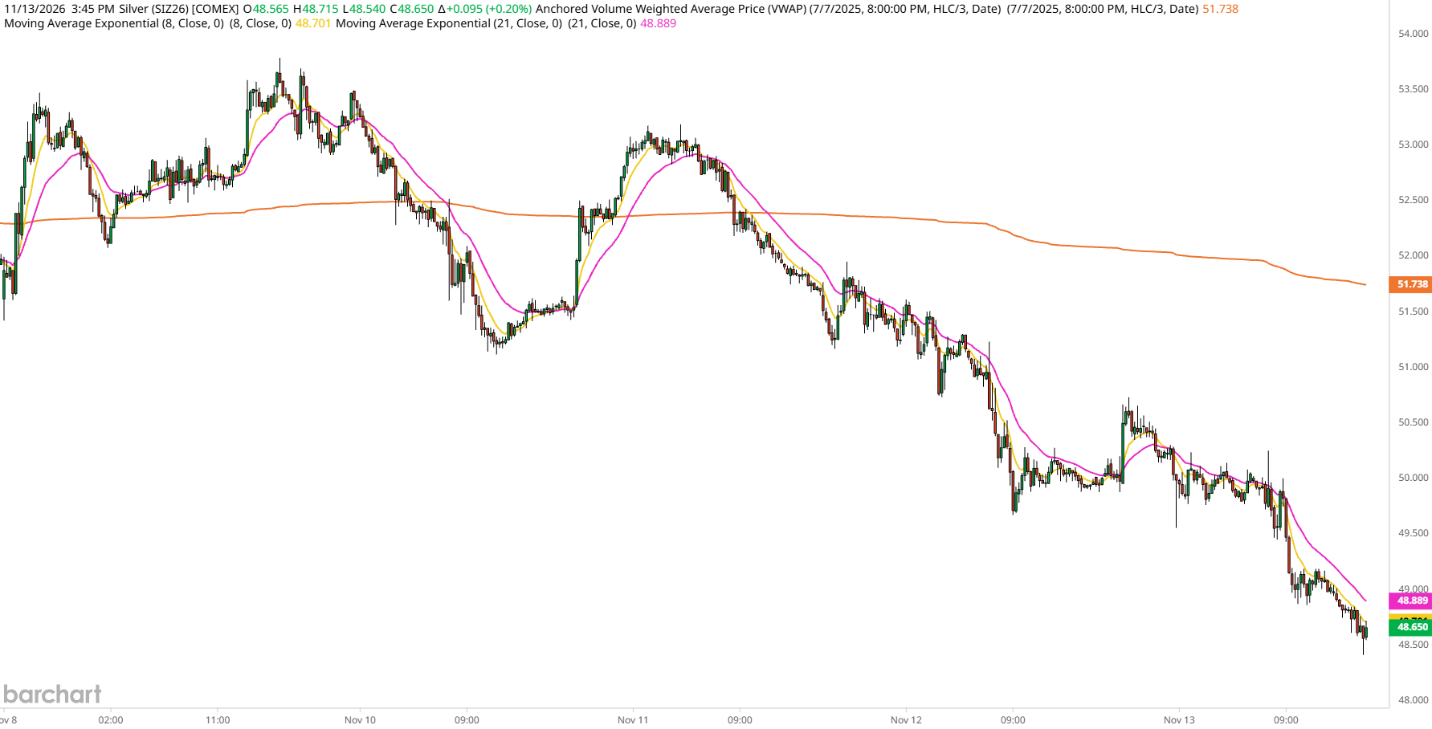
Price is trading well below the anchored VWAP at $51.738, which now acts as distant overhead resistance. Closer in, the 8 EMA at $48.701 and 21 EMA at $48.889 are both above the last price of $48.650 and slope lower. The key support is the recent low near $48.54. A break under it would add to the downside pressure.
What Would Change the Outlook
For spot silver, a trade through $53.73 would flip the main trend to up and turn my bias bullish, with the 50-day moving average at $58.54 as the objective.
For December Comex, my downside bias would change if buyers break the chart pattern by taking out a swing top with conviction. The nearest is the $53.10 lower top, and a move through the $53.78 peak would turn the main trend up.