


EN
Should Earnings Beat Require Action From Sezzle (SEZL) Investors?
- Sezzle reported third quarter 2026 sales of US$166.5 million and net income of US$47.83 million, with both basic and diluted earnings per share from continuing operations above the prior year, and raised full year 2026 revenue growth guidance to about 42.5% from 35%.
- The company’s stronger earnings profile, including nine month sales of US$451.73 million and higher earnings per share, indicates that Sezzle’s core operations are scaling while management expresses greater confidence in the revenue outlook for 2026.
- This article will examine how Sezzle's earlier investment narrative is reshaped by the guidance increase to 42.5% revenue growth for 2026.
Scan beyond Sezzle's raised 42.5% revenue growth guidance and strong 2026 earnings profile by lining it up against 32 high quality undervalued stocks, which also pair solid cash generation with robust balance sheets.
Sezzle Investment Narrative Recap
To own Sezzle, you need to believe the installment payments model can keep attracting users and merchants while still converting a healthy share of revenue into profit. According to J_Tyrader, an investor in the Simply Wall St Community, the appeal sits in strong margins and high returns on invested capital. The raised 42.5% revenue growth outlook supports that thesis by pointing to continued demand across the platform.
The most important short term catalyst is execution against that higher revenue target while preserving credit quality and funding flexibility. The largest near term risk is that recent results include large one off items, which can blur how repeatable the current earnings run rate really is.
The upgraded 2026 revenue guidance sits alongside the latest quarterly report where Sezzle posted US$166.5 million in sales and US$47.83 million in net income for the third quarter. Those numbers, plus nine month sales of US$451.73 million, provide more concrete evidence on how the model is performing as the firm scales up.
For catalysts, this combination of reported profitability and a higher top line target increases the focus on whether Sezzle can maintain earnings growth close to the 24.2% yearly pace analysts expect while managing higher risk funding with no customer deposits. Any deterioration in credit performance or access to financing could challenge that growth story.
J_Tyrader’s narrative estimates a fair value of US$187.88 for Sezzle by applying a two-stage discounted cash flow model. This model assumes 10 years of 25.0% growth that gradually declines to a 2.5% terminal rate, with all cash flows discounted at 14.5% to arrive at that valuation.
Uncover how Sezzle's fair value indicates a 22% potential upside to its current price, which could narrow quickly if Sezzle's momentum holds in investors' models.
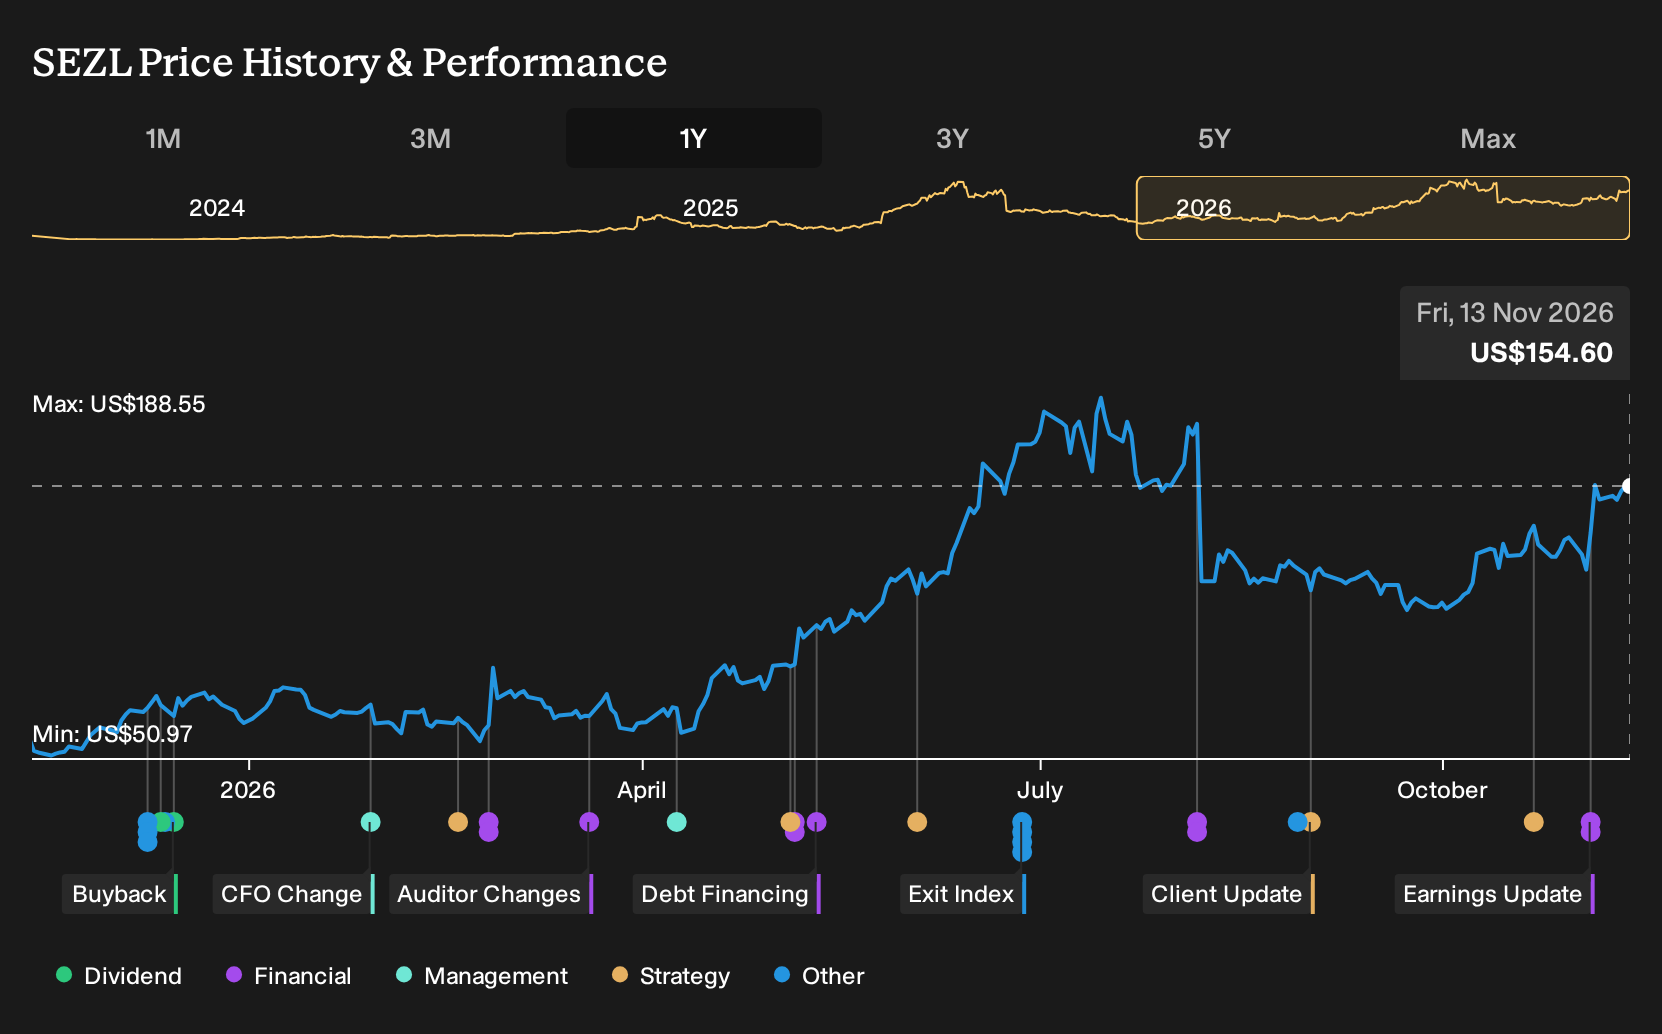
Exploring Other Perspectives
For Sezzle, the biggest swing factor in the more optimistic analyst story is product expansion. The most bullish group was pencilling in roughly 27.8% annual revenue growth and earnings of about US$376.6 million by 2029. However, even those projections did not include this latest guidance hike, so their already upbeat scenario may still shift. You can treat that as a reminder that opinions vary widely, and it can be helpful to compare a few different forecasts before deciding what makes sense for you.
Explore 6 other Sezzle fair value estimates, including one that suggests there could be as much as 25% upside from the current price.
Decide For Yourself
Disagree with existing narratives? Extraordinary investment returns rarely come from following the herd, so go with your instincts.
- A great starting point for your Sezzle research is our analysis highlighting 3 key rewards and 1 important warning sign that could impact your investment decision.
- See our latest analysis for Sezzle. The report includes a comprehensive fundamental analysis summarized in a single visual, the Snowflake, making it easy to evaluate Sezzle's overall financial health at a glance.
Looking for more Sezzle investment ideas?
If Sezzle is already on your radar, it can help to stack it up against other opportunities that share some of the qualities you care about most. Use the Simply Wall St Screener to quickly surface a wider watchlist that fits your risk, income, and quality preferences.
- If you care about stronger balance sheets and healthier fundamentals, scan a list of solid balance sheet and fundamentals (24 results) that could sit alongside Sezzle in a more resilient portfolio mix.
- For investors who want growth potential without ignoring valuation, compare Sezzle with a 20 high quality undiscovered gems that may not yet be widely followed.
- If capital preservation ranks high for you, weigh Sezzle against a 31 resilient stocks with low risk scores that screens for steadier profiles.
Have feedback on this article? Concerned about the content? Get in touch with us directly. Alternatively, email editorial-team@simplywallst.com