


EN
Is Park National (PRK) Undervalued Or Overvalued On Mixed Valuation Signals?
Park National (PRK) continues to trade quietly following recent moves in US regional banks, leaving investors to weigh its latest share performance and financial profile rather than any single headline event.
Recent trading has been subdued for Park National, with the share price edging around its current level of $176.51. The 90 day share price return fell 15.05%, while the year to date share price return of 14.38% and 1 year total shareholder return of 16.96% point to earlier momentum that has cooled in recent months.
Scan similar regional banks with quieter trading patterns and see how Park National compares with 31 resilient stocks with low risk scores on fundamentals and recent returns.
Park National looks like a steady regional banking franchise with solid recent shareholder returns. After the latest pullback, the key question is whether that quality is already fully reflected in the current US$176.51 share price.
Price-to-Earnings of 15.9x: Is it justified?
Valuation on Park National today hinges on a simple tension. The stock trades on a P/E of 15.9x while the SWS DCF model points to a future cash flow value of $255.17 against the current $176.51 share price.
The P/E ratio compares the current share price to earnings per share and shows how much investors are paying for each dollar of profit. For a regional bank like Park National, that multiple often reflects views on earnings quality, balance sheet strength, and the stability of its loan book and deposit base.
Here the current P/E of 15.9x sits above the estimated fair P/E of 12.2x. This suggests the market is paying a richer price for those earnings than the fair ratio indicates. It also exceeds the US Banks industry average of 11.3x and the peer average of 14.4x. This signals investors are valuing Park National more highly than both the wider sector and its closest comparables and that premium could compress toward the fair ratio level over time.
Explore the SWS fair ratio for Park National.
Result: Price-to-Earnings of 15.9x (OVERVALUED)
Still, Park National faces the risk that its premium P/E could contract if earnings growth slows or if credit costs rise more than expected.
Find out about the key risks to this Park National narrative.
Another View: SWS DCF Model Says Undervalued
The P/E points to Park National looking expensive, but the SWS DCF model tells a different story. On that cash flow view, an estimated future value of $255.17 versus the current $176.51 suggests the shares trade around 30.8% below that fair value line.
For investors, that gap cuts both ways. It hints at potential upside if those projected cash flows arrive. It also raises the question of how much weight to place on long range assumptions compared with the earnings multiple, which is already above sector and peer levels. Which signal carries more weight for you right now?
Look into how the SWS DCF model arrives at its fair value.
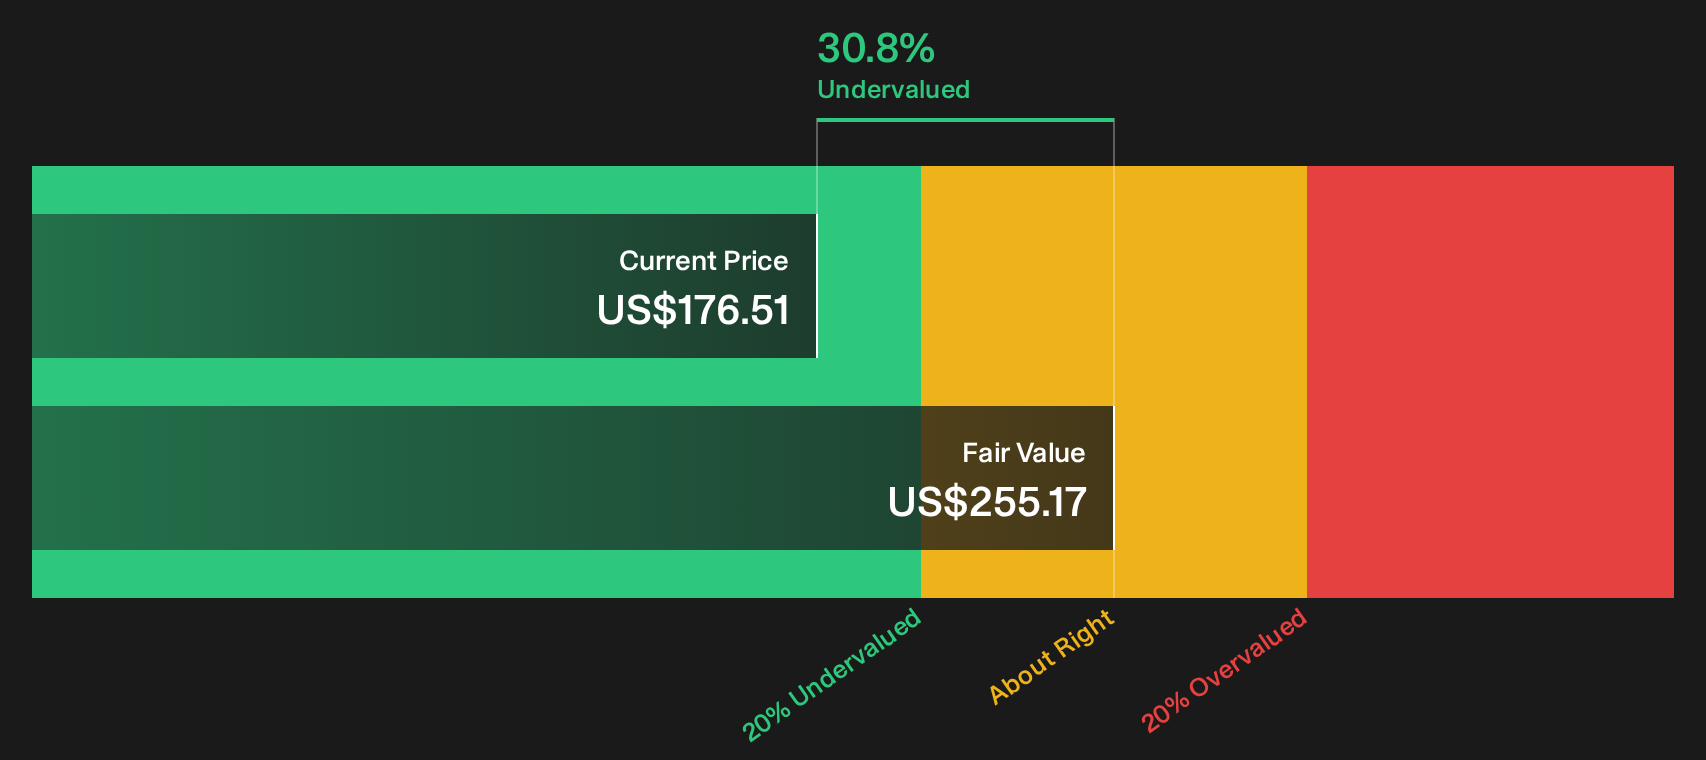
Simply Wall St performs a discounted cash flow (DCF) on every stock in the world every day (check out Park National for example). We show the entire calculation in full. You can track the result in your watchlist or portfolio and be alerted when this changes, or use our stock screener to discover 32 high quality undervalued stocks. If you save a screener we even alert you when new companies match - so you never miss a potential opportunity.
Next Steps
If this mix of premium P/E and discounted DCF leaves you on the fence, consider acting while the data is fresh and test your own thesis against the 4 key rewards
Looking for more Park National investment ideas?
Do not stop with Park National alone. A few minutes with the Simply Wall Street Screener can surface other opportunities you might wish you had seen earlier.
- Target reliable cash generators by scanning companies with strong income and resilient payouts using the 6 dividend fortresses.
- Spot potential future bargains before they are widely discussed by running the 20 high quality undiscovered gems.
- Zero in on businesses with healthier finances by filtering for the list of solid balance sheet and fundamentals (24 results).
Have feedback on this article? Concerned about the content? Get in touch with us directly. Alternatively, email editorial-team@simplywallst.com