


EN
Is agilon health (AGL) Fully Priced After Its 7x Run?
agilon health has delivered a very large 1 year share price gain, which naturally pushes investors to ask whether the current valuation still lines up with what the business is generating in sales. With a stock that has already moved this far, the question becomes how much of its revenue story is already captured in today's price.
- The stock is up roughly 7x over the past year, which puts a lot of focus on whether its present sales can justify that kind of market value.
- Recent revenue performance and a stronger profit print may support investor expectations for the timing and durability of future cash generation from agilon health's existing sales base.
- Your read on agilon health is one view; the desks covering it have another. See what analysts think agilon health's shares could be worth.
The stock's next move may depend on whether agilon health's current share price can be explained by its sales when compared with the Fair Ratio benchmark.
To put agilon health's recent move in context and see how other companies with strong fundamentals are being priced on the market, it can help to scan the solid balance sheet and fundamentals stocks screener (24 results).
Is agilon health Fairly Priced on Sales?
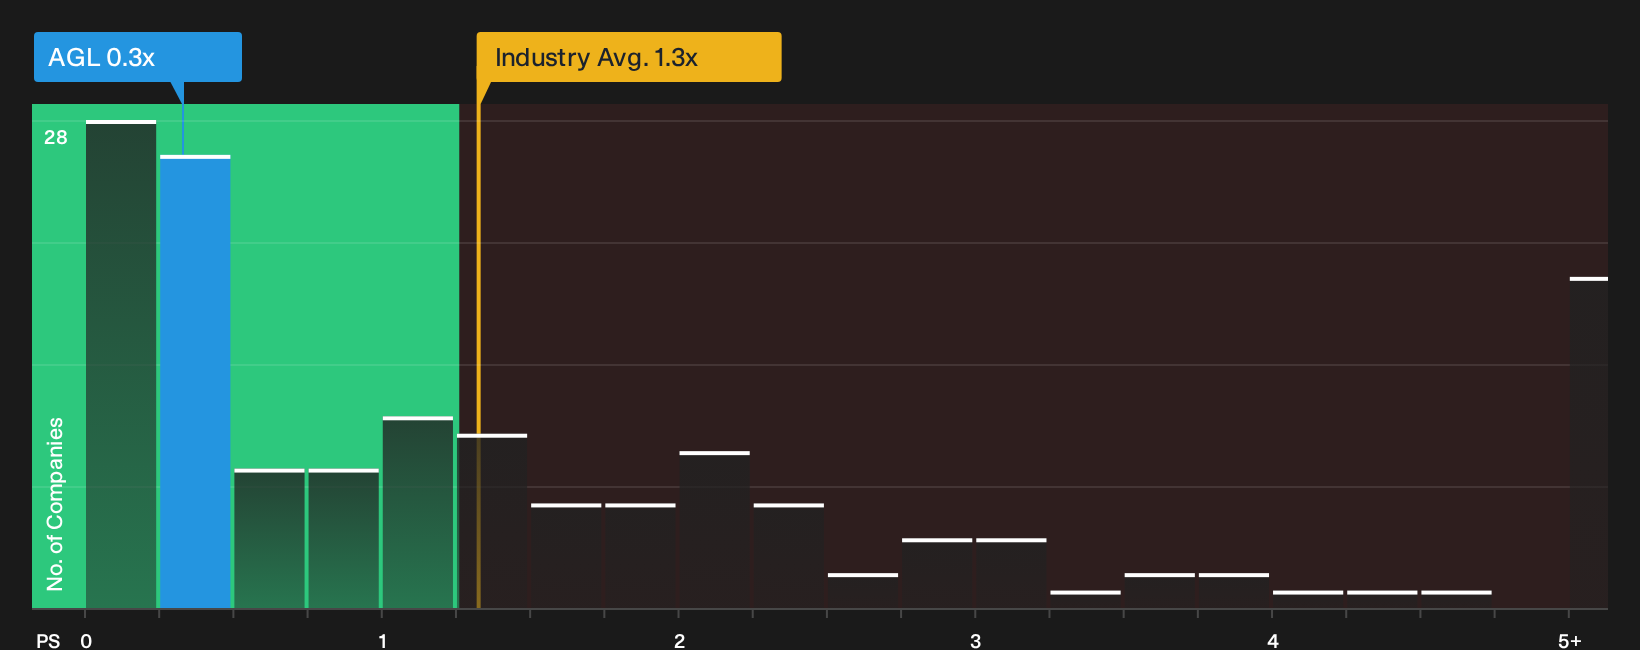
The P/S ratio is usually a better starting point for agilon health than P/E, because revenue is the cleaner anchor while cash flows and earnings settle. On this measure, the stock trades on a P/S multiple of about 0.3x, which is well below the broader Healthcare sector average of roughly 1.3x and also below the closer peer group on about 2.4x.
Because the Fair Ratio framework looks at agilon health's own growth profile, margins, scale and risk, it suggests a P/S level slightly above where the shares trade today. That points to a valuation that is about right rather than aggressively priced, even after the strong Q3 2026 revenue and profit print, which has already improved sentiment without lifting the multiple toward peer levels. For investors, the gap between the current P/S and this tailored benchmark highlights how much weight the market is putting on the quality and durability of future sales across agilon health's model, and whether that leaves enough upside for the risk taken. Explore the numbers behind agilon health's P/S valuation.
The agilon health Narrative: What Would Justify Today's Price?
Simply Wall St Narratives pick up where the agilon health valuation puzzle leaves off by spelling out which specific paths for future growth, margins and earnings would need to play out for the stock to be worth materially more or materially less than today’s price. They also turn a single model output into a set of concrete expectations you can watch over time on the Community page to see whether the real world keeps matching the story in the numbers.
Bulls and bears are looking at the same agilon health numbers yet drawing very different conclusions about how much is already reflected in the price.
Bull case: roughly fairly valued
This view comes from the analyst consensus Narrative on Simply Wall St, which blends multiple analyst targets and forecasts into one scenario.
"The shift to profitability-focused growth, including lower Medicare Part D exposure at less than 15% of the book and tighter contracting with payers, can reduce earnings volatility and help translate agilon health’s higher medical margin guidance into more predictable adjusted EBITDA and operating cash flow…"
Discover why this Narrative puts agilon health at roughly fairly valued.
Bear case: 36% overvalued
This angle is set out in the bearish analyst Narrative on Simply Wall St, which leans on the most pessimistic targets and assumptions.
"Despite tighter payer contracting, reduced Part D exposure and one new full risk deal, the pause on new market expansion until at least 2028 and the need for 12 to 18 month lead times for any future implementations mean that weaker Medicare Advantage membership trends may cap revenue growth and slow operating leverage from existing platforms…"
Explore why this Narrative puts agilon health at 36% overvalued.
agilon health’s valuation still leaves one crucial angle open
Numbers only tell part of the story for agilon health, because the people directing capital allocation and how they are rewarded can heavily influence what those figures become over time. See who runs agilon health and how they are paid.
Have feedback on this article? Concerned about the content? Get in touch with us directly. Alternatively, email editorial-team@simplywallst.com