


EN
What Is Drawing Fresh Attention To ESAB (ESAB)?
ESAB earnings jolt highlights mixed signal for shareholders
ESAB (ESAB) just posted third quarter results that paired higher sales with lower profitability, giving investors fresh numbers to reassess the stock after a strong past month but weaker year to date performance.
Over the past month, ESAB has seen a sharp shift in sentiment, with a 30 day share price return of 28.95% lifting the stock to US$83.25. This comes even though the year to date share price return is still down 26.05% and the 1 year total shareholder return is down 25.13%. The 3 year total shareholder return of 6.34% shows only modest progress over a longer stretch as investors weigh stronger sales against weaker earnings.
Compare ESAB's mixed profit picture with other industrials by scanning our hand picked list of solid balance sheet and fundamentals (24 results) for ideas that pair sturdier finances with the kind of momentum ESAB just showed.
ESAB has sprinted higher while analyst targets and intrinsic value estimates still point to a wide gap. Is this rally closing the distance, or leaving unusual upside on the table?
Most Popular Narrative: 30.5% Undervalued
ESAB's last close at $83.25 sits well below the analyst consensus Narrative fair value of about $119.73, which the analyst consensus Narrative on Simply Wall St derives from detailed revenue, earnings and discount rate forecasts rather than a simple multiple comparison.
The industrial compounder approach, reflected in 18 acquisitions including EWM, Bavaria, DeltaP, Aktiv and Eddyfi, together with the EBXai operating system and a stated target of 2x to 3x net leverage while maintaining about 90% cash flow conversion, is intended to keep adding higher margin, faster growing businesses that can support EBITDA margin expansion and cash generation.
See why 4 investors see ESAB as 30% undervalued.
Result: Fair Value of $119.73 (UNDERVALUED)
Still, ESAB’s asbestos litigation overhang and tariff related uncertainty around North America and Mexico could quickly chip away at that perceived valuation gap.
Find out about the key risks to this ESAB narrative.
Another View: What ESAB's P/E Is Really Saying
ESAB looks cheap against its own future cash flow value, with the stock trading about 48.6% below the Simply Wall St estimate of $161.92. Yet the picture shifts when price is compared with earnings today.
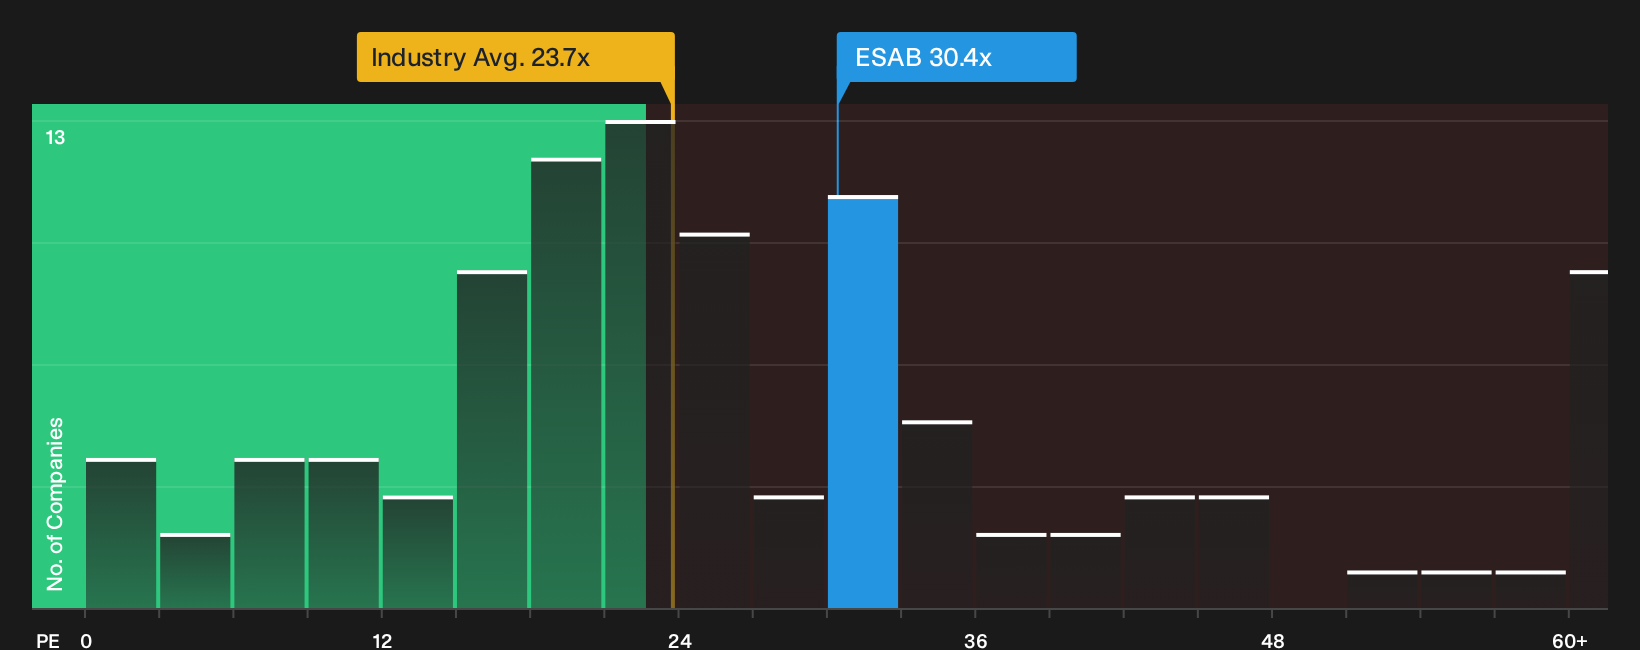
The shares trade on a P/E of 30.4x. That is higher than the wider US Machinery sector at 23.7x, which implies investors are already paying a premium versus the broader group. At the same time, the ratio sits below a 38.3x peer average and only slightly under the 31.8x fair ratio that the regression work suggests the market could move toward.
For you as a shareholder, that mix of a premium to the sector, a discount to direct peers, and a P/E that is close to the fair ratio means the multiple alone does not clearly indicate a bargain or a bubble. The key question is whether ESAB can deliver enough earnings growth to justify staying above the industry but near that fair ratio, or whether the market starts to compress the multiple instead.
See what the numbers say about this price — find out in our valuation breakdown.
Next Steps
Mixed signals like these tend to polarize opinion, so move quickly and review the full picture yourself by weighing both the concerns and the potential upside highlighted in 3 key rewards and 3 important warning signs.
Looking for more investment ideas beyond ESAB?
Do not stop your research with ESAB. Broader opportunity often comes from scanning high quality watchlists where strong balance sheets, steady income and mispriced stories line up.
- Target stability first and review a 31 resilient stocks with low risk scores that focuses on resilient businesses with lower risk profiles than the typical stock you hear about every day.
- Hunt for mispriced quality and work through a 32 high quality undervalued stocks that spotlights companies with strong fundamentals trading at what may be discounted valuations.
- Spot potential future leaders early and study a 20 high quality undiscovered gems that highlights underfollowed stocks with solid financial traits before attention crowds in.
Have feedback on this article? Concerned about the content? Get in touch with us directly. Alternatively, email editorial-team@simplywallst.com