


EN
Is Brookfield (TSX:BN) Fairly Valued Following Its Third Quarter 2026 Results?
Brookfield (TSX:BN) moved into focus after reporting third quarter 2026 results. The company reported US$20.7b in sales, US$1.3b in net income, and a quarterly cash dividend of US$0.07 per share.
Brookfield’s share price has climbed 13.7% over the past month even though the year to date share price return is down 7.5%. The 3 year total shareholder return of 93.6% signals strong longer term momentum that recent earnings and AI infrastructure ambitions are helping to frame for investors.
Scan other asset managers and alternative finance stocks showing similar fundraising strength and fee-based momentum using our curated 8 high quality undiscovered gems that echo Brookfield’s multi-asset profile.
After a 13.7% surge in a month but a weaker year to date picture, Brookfield now raises a simple puzzle for investors. Is the bigger opportunity still ahead, or has this run already used up most of the upside before valuation even gets discussed?
Most Popular Narrative: 28% Undervalued
Brookfield’s most followed narrative pegs fair value at about CA$82 per share, compared with a last close of CA$59.31. According to ANTONI0, an investor in the Simply Wall St Community who built that valuation, the gap hinges on how fee earnings, insurance spreads and carried interest eventually come through the income line.
BN is a holding company with three earnings engines: a fee-earning asset manager, an annuity insurer, and stakes in real-asset operating businesses, plus a stock of unrealised carry. LTM distributable earnings before realisations (DE-bR) were US$5.65b, or US$2.39 per share, up 7%; Q2 2026 alone was up 15% per share (Q2 2026 release) [CO].
See why 11 investors see Brookfield as 28% undervalued.
Result: Fair Value of CA$82 (UNDERVALUED)
Still, Brookfield’s heavy reliance on Wealth Solutions for earnings and its self-assessed plan value could quickly undermine this 28% undervalued story if either element weakens.
Find out about the key risks to this Brookfield narrative.
Brookfield’s Rich P/E Puts Pressure On The Undervaluation Case
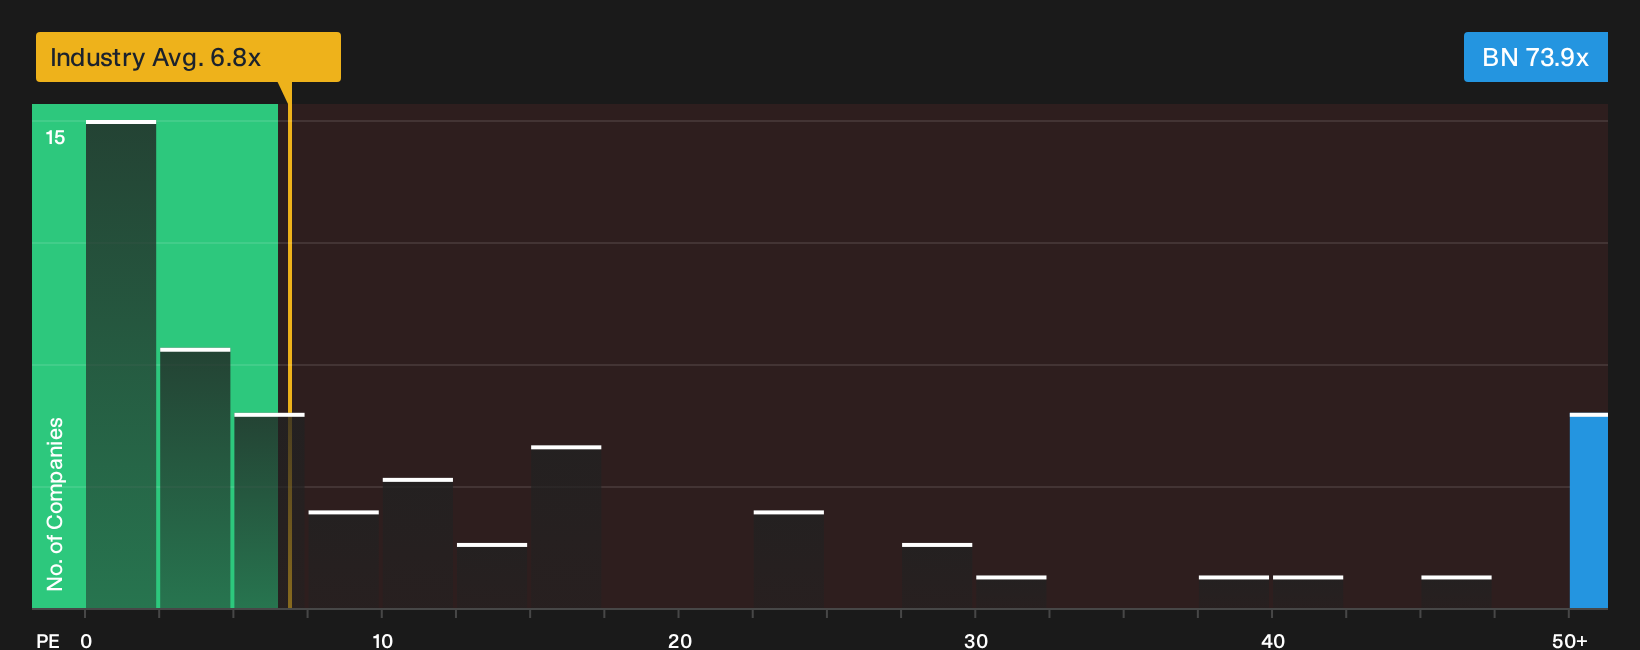
On simple earnings multiples, Brookfield looks expensive. The stock trades on a P/E of 73.9x, versus 6.8x for the wider Canadian capital markets industry and 13.6x for its closest peers. That is a big gap for any investor to accept while leaning on an undervalued thesis built on internal cash metrics.
Such a premium multiple can point to quality, but it also compresses the margin for error. If Brookfield’s fee growth or insurance spreads disappoint, or if the market shifts back toward peer P/E levels, the re-rating risk would sit with shareholders who bought into the 28% undervalued story. The question is whether the cash-based measures fully justify paying more than 10x the sector P/E today.
To see what the numbers say about this high P/E and how it compares with peers, check the valuation breakdown in our See what the numbers say about this price — find out in our valuation breakdown.
Next Steps
Mixed signals on Brookfield so far. If you want to move quickly and build your own judgment, start with a clear view of 2 key rewards and 2 important warning signs
Looking for more investment ideas beyond Brookfield?
If Brookfield has sharpened your thinking, do not stop here. Use focused stock lists to pressure test your thesis and uncover alternatives before the market prices them in.
- Target income resilience by scanning companies described as dividend fortresses through the 3 dividend fortresses.
- Hunt for quality at a discount by reviewing our curated pool of 5 high quality undervalued stocks that pair solid fundamentals with appealing pricing.
- Prioritise capital preservation by filtering for 9 resilient stocks with low risk scores that aim to balance returns with measured risk profiles.
Have feedback on this article? Concerned about the content? Get in touch with us directly. Alternatively, email editorial-team@simplywallst.com