


EN
Following Third Quarter Earnings, Is TXNM Energy (TXNM) Now Fully Valued?
TXNM Energy (TXNM) is back in focus after its third quarter report on October 30, 2026, showed higher sales, net income, and earnings per share compared with the same period last year.
The third quarter update appears to be the key driver behind TXNM Energy’s recent move, with the share price edging higher over the past three months and the 1-year total shareholder return of 5.3% sitting on top of a 3-year total shareholder return of about 49%. This points to momentum built over a longer stretch.
Scan how TXNM Energy compares with other regulated utilities on cash flow, balance sheet strength, and recent momentum by reviewing the curated list of solid balance sheet and fundamentals (23 results).For TXNM Energy, that recent climb can look like a simple mood shift or a cleaner read on an improving utility franchise. The valuation now needs to show which story the current price really supports.
Price-to-Earnings of 28.3x: Is it justified?
TXNM Energy is trading on a P/E of 28.3x, which puts a rich tag on the recent $58.82 share price compared with peers.
The P/E ratio compares the current share price with earnings per share. For regulated utilities such as TXNM Energy, it is a quick way to see how much investors are paying for each dollar of profit. Higher multiples often line up with expectations for steadier profit growth, cleaner earnings quality, or lower perceived risk.
TXNM Energy shows high quality earnings, profit growth of 29.2% over the past year, and improving net profit margins, so a premium P/E can reflect investors placing value on that earnings profile. At the same time, earnings have grown by only 0.2% per year over the past five years, return on equity is described as low at 6.6%, and interest cover plus dividend cash coverage are flagged as weaker. As a result, the current multiple leans heavily on confidence that the recent profit acceleration is sustainable.
The premium is clear. TXNM Energy trades on a P/E of 28.3x against 19.3x for the US Electric Utilities industry and 20.4x for the peer group average, which is a much higher earnings multiple than those reference points.
See what the numbers say about this price — find out in our valuation breakdown.
Result: Price-to-Earnings of 28.3x (OVERVALUED)
Still, TXNM Energy relies on a tightly regulated Texas and New Mexico footprint, so any setback in allowed returns or funding costs could quickly challenge that rich P/E story.
Find out about the key risks to this TXNM Energy narrative.
Another View on TXNM Energy’s Value
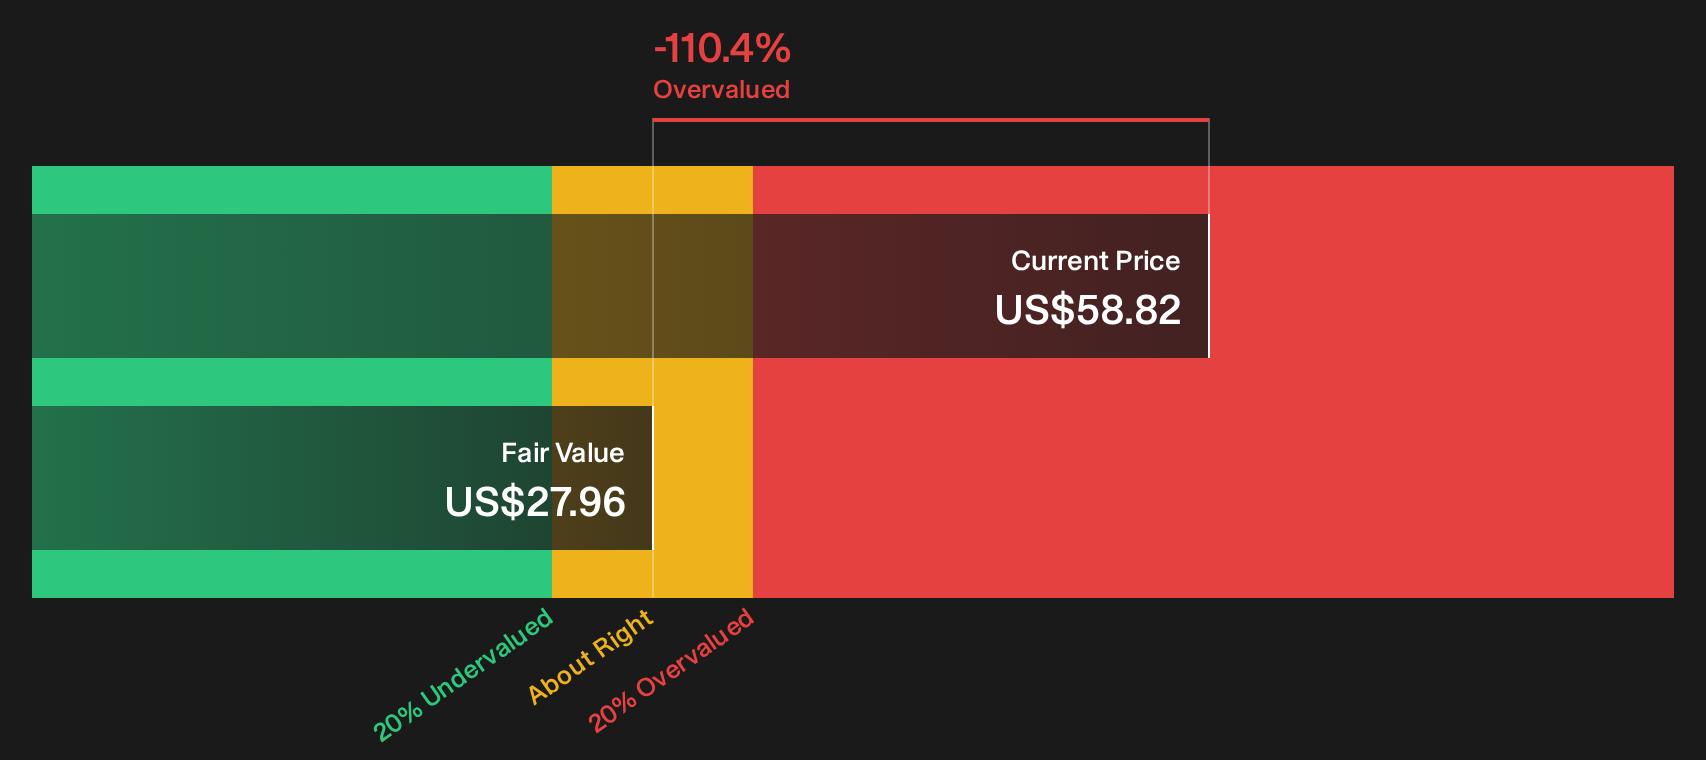
The P/E tag looks expensive, but the SWS DCF model goes even further. On that framework, TXNM Energy at $58.82 sits well above an estimated future cash flow value of $27.96, which lands in clearly overvalued territory and raises a simple question for holders: How much optimism is already baked in?
For readers who want to see how that cash flow result is built line by line, Look into how the SWS DCF model arrives at its fair value.
Simply Wall St performs a discounted cash flow (DCF) on every stock in the world every day (check out TXNM Energy for example). We show the entire calculation in full. You can track the result in your watchlist or portfolio and be alerted when this changes, or use our stock screener to discover 31 high quality undervalued stocks. If you save a screener we even alert you when new companies match - so you never miss a potential opportunity.
Next Steps
If this TXNM Energy picture feels mixed to you, that is the point. It is why you should move quickly and test the story against the data yourself before sentiment shifts again by weighing the 1 key reward and 2 important warning signs.
Looking for more TXNM Energy sized ideas?
If TXNM Energy now looks fully priced to you, do not park cash on the sidelines. Consider using targeted shortlists built from real data.
- Target companies with resilient balance sheets and steady fundamentals with a curated list of solid balance sheet and fundamentals (23 results) that helps you focus on financial strength.
- Review a 31 high quality undervalued stocks that filters for quality businesses trading at prices that may not fully reflect their fundamentals.
- Zero in on lesser known opportunities through a 20 high quality undiscovered gems that highlights companies with solid metrics that many investors may be overlooking.
Have feedback on this article? Concerned about the content? Get in touch with us directly. Alternatively, email editorial-team@simplywallst.com