


EN
Why a Turn in 2-Year Yields Can Be Bullish for Gold
The US 2-year yield has risen sharply and is now around 4.87%, well above the Federal Reserve's 3.75% to 4.00% funds target range. After Tuesday's hotter-than-expected October CPI report, in which the headline index rose 0.4% and core prices were up 0.3%, markets are fully pricing a rate hike at the December FOMC meeting.
That gap between the 2-year and the funds rate is the key point on the chart below. The 2-year yield tends to lead Fed policy, so when it runs ahead like this, the Fed often has to catch up. We think one or two more hikes may still be needed, and that the 2-year itself could stretch toward 5.2-5.3%, near the prior highs, before it turns lower.
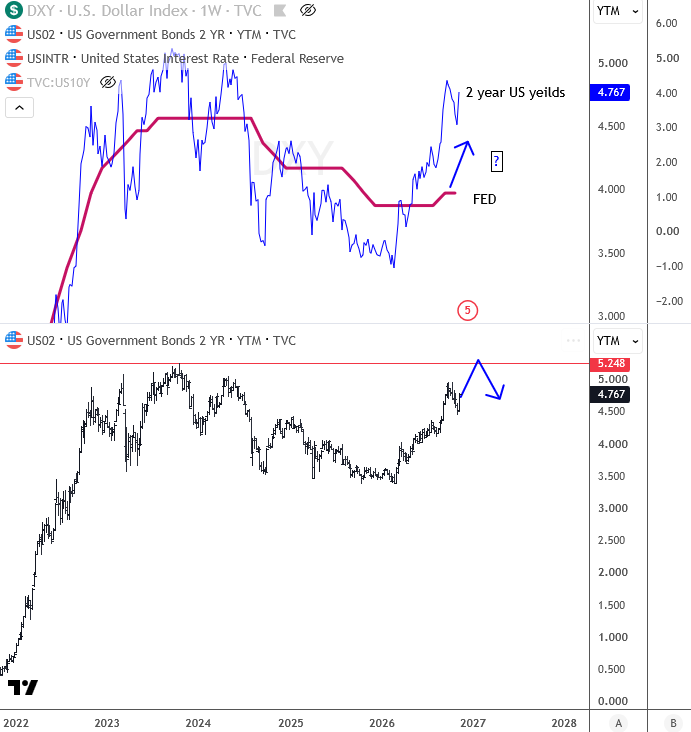
Why would a turn in yields matter for gold? Gold pays no interest, so when bond yields are rising, the opportunity cost of holding it goes up. Investors can earn a higher return in Treasuries or cash, and that makes a non-yielding metal less attractive. The same idea shows up in real yields: when yields are high relative to inflation, gold often struggles; when yields start to roll over, that headwind fades. There is also a dollar link. Higher US yields have helped keep the dollar firm, and a strong dollar weighs on gold. If the 2-year tops out and starts to decline, some of that dollar support can fade as well, which would be a friendlier backdrop for metals.
History points in the same direction. Gold and silver have often found a more durable low around the end of a hiking cycle, or once the market starts to price cuts rather than further tightening. The turn in market rates, especially in the 2-year, is usually the earlier signal, because that part of the curve leads official policy.
Gold is trading near $3,880 as we write, and silver is near $50. On the weekly gold chart, we count a large impulse from the 2022 lows that completed wave (III) at the 5,596 high in early 2026. Since then, gold has been working through a higher-degree wave (IV) correction. The ideal support zone is the orange box on the chart, roughly 3,900 to 3,266, with the 0.5 retracement at 3,614. After that correction, the chart projects a wave (V) rally to new highs.
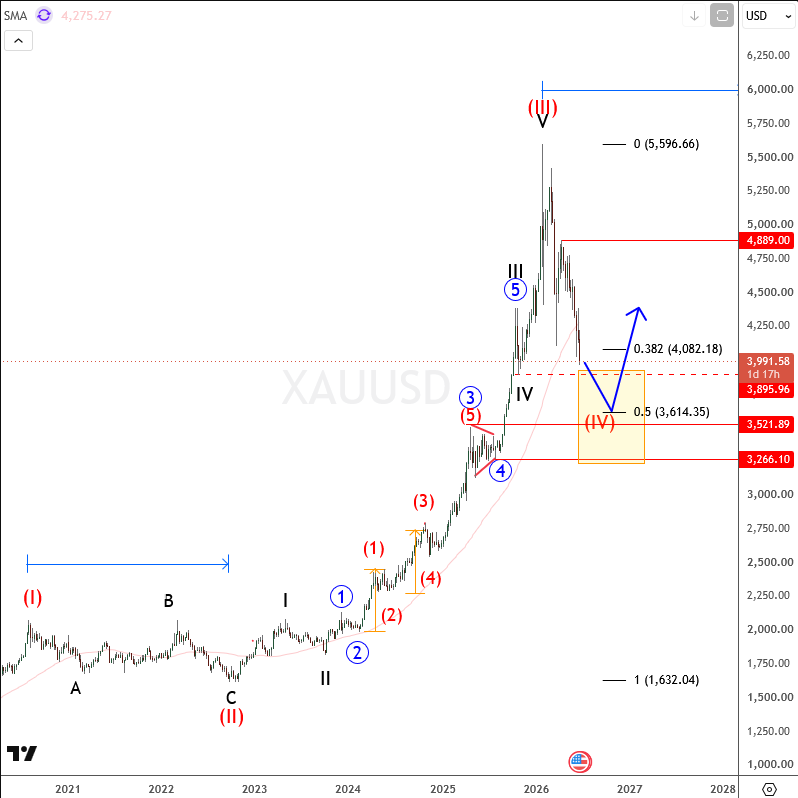
The short-term picture is still bearish. On the 4-hour chart, gold has broken trendline support from the June lows and has made new 2026 lows. We see it moving lower in wave C, or in a second zigzag, toward 3,700-3,800, and possibly 3,500. Resistance is at 4,100-4,200. Even so, this decline is coming into the bigger wave (IV) support zone, and that is where a later low could line up with a top in the 2-year yield near 5.2-5.3%. That combination — yields topping out as gold reaches higher-degree support — is the setup we would watch for a metals rebound.
If you want to follow these charts with us, you can try any monthly plan for €1 for 14 days at https://wavetraders.com/elliott-wave-plans/.
Trade well,
GH