


EN
Why SG HoldingsLtd (TSE:9143) Is Getting Attention Today
SG HoldingsLtd (TSE:9143) has packed a lot into early November 2026, pairing higher half year revenue and profit with a fresh buyback plan, a dividend increase, and upgraded full year guidance.
SG HoldingsLtd’s latest announcements appear to have reset sentiment, with a 9.12% 7 day share price return and a 10.67% 30 day share price return pushing the stock to ¥1,597.5. However, the 3 year total shareholder return is still down 13.39% and the 5 year total shareholder return is down 30.44%, suggesting short term momentum is building while longer term holders remain under water.
Surf 73 high quality undiscovered gems that, like SG HoldingsLtd today, combine fresh earnings news with active capital return plans.SG HoldingsLtd has run hard on the back of better numbers, richer cash returns, and a buyback announcement, yet analyst targets and intrinsic estimates still signal a gap. How far from fair value does ¥1,597.5 really look?
Preferred Price-to-Earnings of 15x: Is it justified?
On current numbers, SG HoldingsLtd trades on a P/E of 15x, which puts the ¥1,597.5 share price in an interesting middle ground between peer and fair ratio signals.
The P/E multiple compares the stock price with earnings per share, so it shows how much investors pay today for each unit of profit. For a logistics and delivery group with multiple operating segments, this is a straightforward way to gauge how the market is weighing current profitability against expectations for future earnings.
Relative pricing sends a mixed message. Compared with the peer average of 49.2x, the stock screens as cheap, which suggests the market is not assigning the same earnings premium as sector comparables. Compared with the estimated fair P/E of 16.3x, the current 15x level looks closer to a mild discount that the market could eventually move towards if forecasts and cash generation hold up.
Explore the SWS fair ratio for SG HoldingsLtd.
Result: Price-to-earnings of 15x (UNDERVALUED)
Still, the narrative around SG HoldingsLtd could be knocked off course if delivery volumes soften, or if competition forces sharper pricing and squeezes margins.
Find out about the key risks to this SG HoldingsLtd narrative.
Another View on SG HoldingsLtd: Cash Flows Tell a Different Story
The earnings based P/E picture suggests only a mild discount for SG HoldingsLtd, yet the SWS DCF model points to something stronger. With the share price at ¥1,597.5 versus an estimated future cash flow value of ¥2,247.65, the stock screens as trading about 28.9% below that cash flow based mark. That kind of gap can look like upside or a warning depending on how confident you are in those long term assumptions. The key question is which story you place more weight on: the earnings-based view or the cash-flow-based view.
Look into how the SWS DCF model arrives at its fair value.
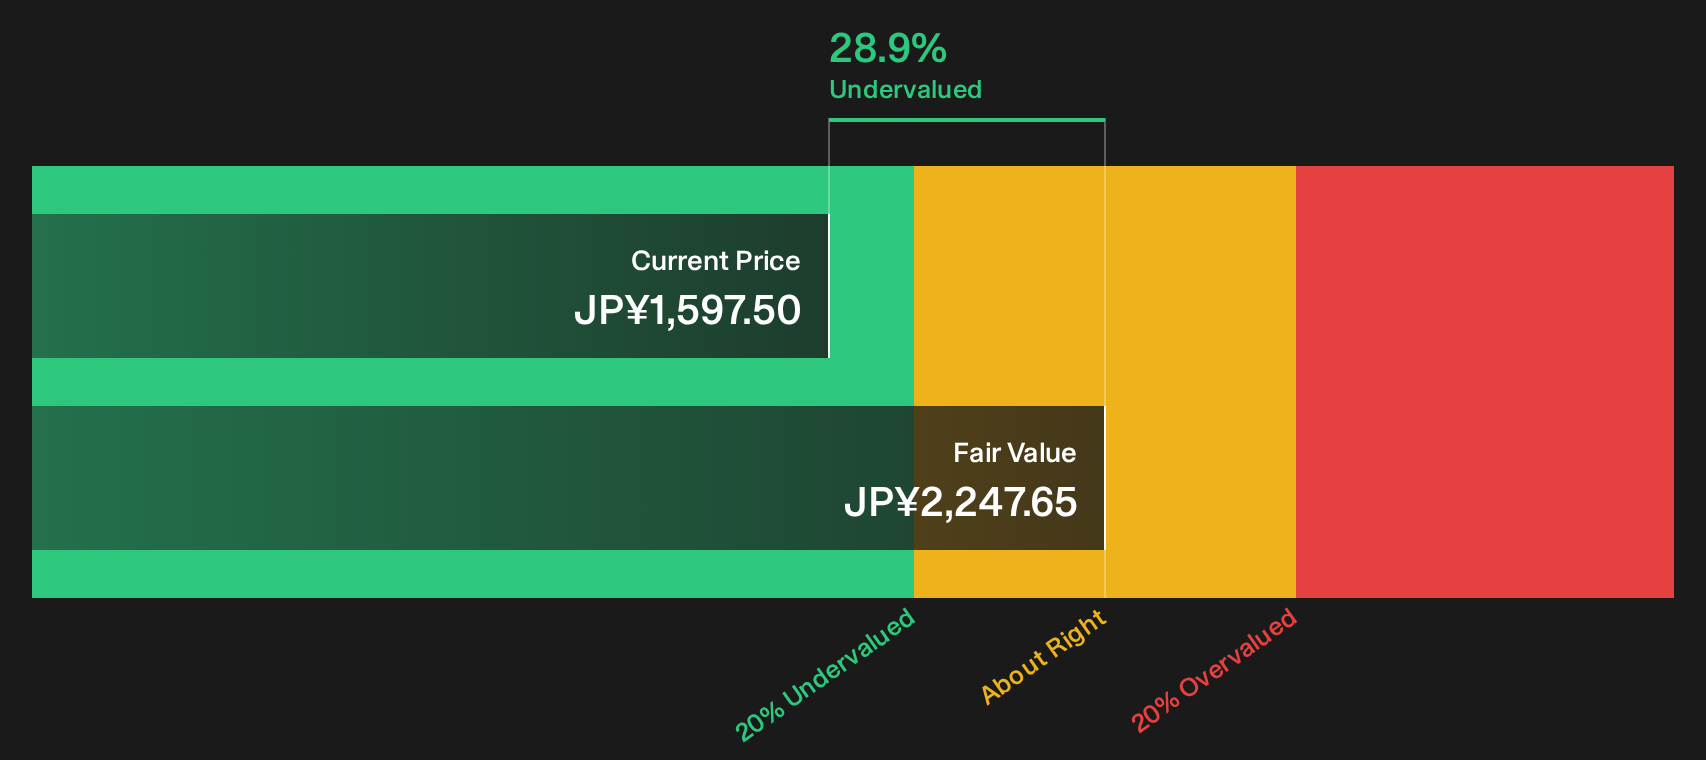
Simply Wall St performs a discounted cash flow (DCF) on every stock in the world every day (check out SG HoldingsLtd for example). We show the entire calculation in full. You can track the result in your watchlist or portfolio and be alerted when this changes, or use our stock screener to discover 21 high quality undervalued stocks. If you save a screener we even alert you when new companies match - so you never miss a potential opportunity.
Next Steps
Does this mix of potential upside and flagged issues feel balanced to you, or skewed one way? Take a closer look at the detailed breakdown of SG HoldingsLtd and weigh the 2 key rewards and 2 important warning signs.
Looking for more investment ideas beyond SG HoldingsLtd?
If SG HoldingsLtd has sharpened your focus on value and quality, do not stop here. Broaden your opportunity set and let the data do some heavy lifting.
- Target resilience first and put capital to work in companies that score well on stability using the 19 resilient stocks with low risk scores.
- Hunt for quality at a reasonable price by scanning companies that look attractively priced on fundamentals through the 21 high quality undervalued stocks.
- Strengthen your income stream by reviewing stocks that combine higher yields with sturdier balance sheets via the 27 dividend fortresses.
Have feedback on this article? Concerned about the content? Get in touch with us directly. Alternatively, email editorial-team@simplywallst.com