


EN
Aisin (TSE:7259), What Is Behind The Fresh Attention?
Dividend decision puts Aisin in focus
Aisin (TSE:7259) moved back onto investor radars after affirming a second quarter dividend of ¥35 per share for the fiscal year ending March 31, 2027, up from ¥30 previously.
Recent trading shows a mixed picture for Aisin, with the share price up 4.35% over the past week but still down 26.95% on a year to date share price basis, while the 5 year total shareholder return of 85.11% points to much stronger long run momentum.
Scan how Aisin stacks up on income strength by comparing it with hand picked payout plays in the 27 dividend fortresses before you decide where dividend risk and reward feel acceptable.
Aisin now trades at ¥2,194.5 while consensus and intrinsic estimates sit higher. The next step is straightforward: how far does fair value really look from here based on these numbers?
Price-to-earnings of 10x: Is it justified for Aisin?
Aisin trades on a P/E of roughly 10x at a share price of ¥2,194.5, which sits between its industry and peer benchmarks and gives a mixed valuation signal around that dividend decision.
The P/E ratio compares what investors are paying today for each unit of current earnings. It matters for an auto parts group like Aisin because profit cycles, capital intensity and competition all influence what investors are willing to pay for those earnings in advance.
Within its own broader peer set, the stock screens as cheap. The current P/E of 10x is described as good value against a peer average of 18.3x, a wide gap that suggests the market is attaching a materially lower earnings tag to Aisin than the level peers trade on, and that this gap could close if sentiment shifted.
Against the narrower JP Auto Components industry, that same 10x P/E is described as expensive relative to the 9.2x industry average, which indicates that investors are assigning a modest premium multiple versus sector earnings. At the same time, the estimated fair P/E of 13.2x from regression work implies a level the valuation could move toward if Aisin were priced more in line with underlying factors captured by that fair ratio model.
Explore the SWS fair ratio for Aisin.
Result: Price-to-earnings of 10x (ABOUT RIGHT)
Still, Aisin faces pressure if auto demand weakens, or if capital needs in transmissions and eAxle projects weigh more heavily on future earnings power.
Find out about the key risks to this Aisin narrative.
Another view on Aisin’s value
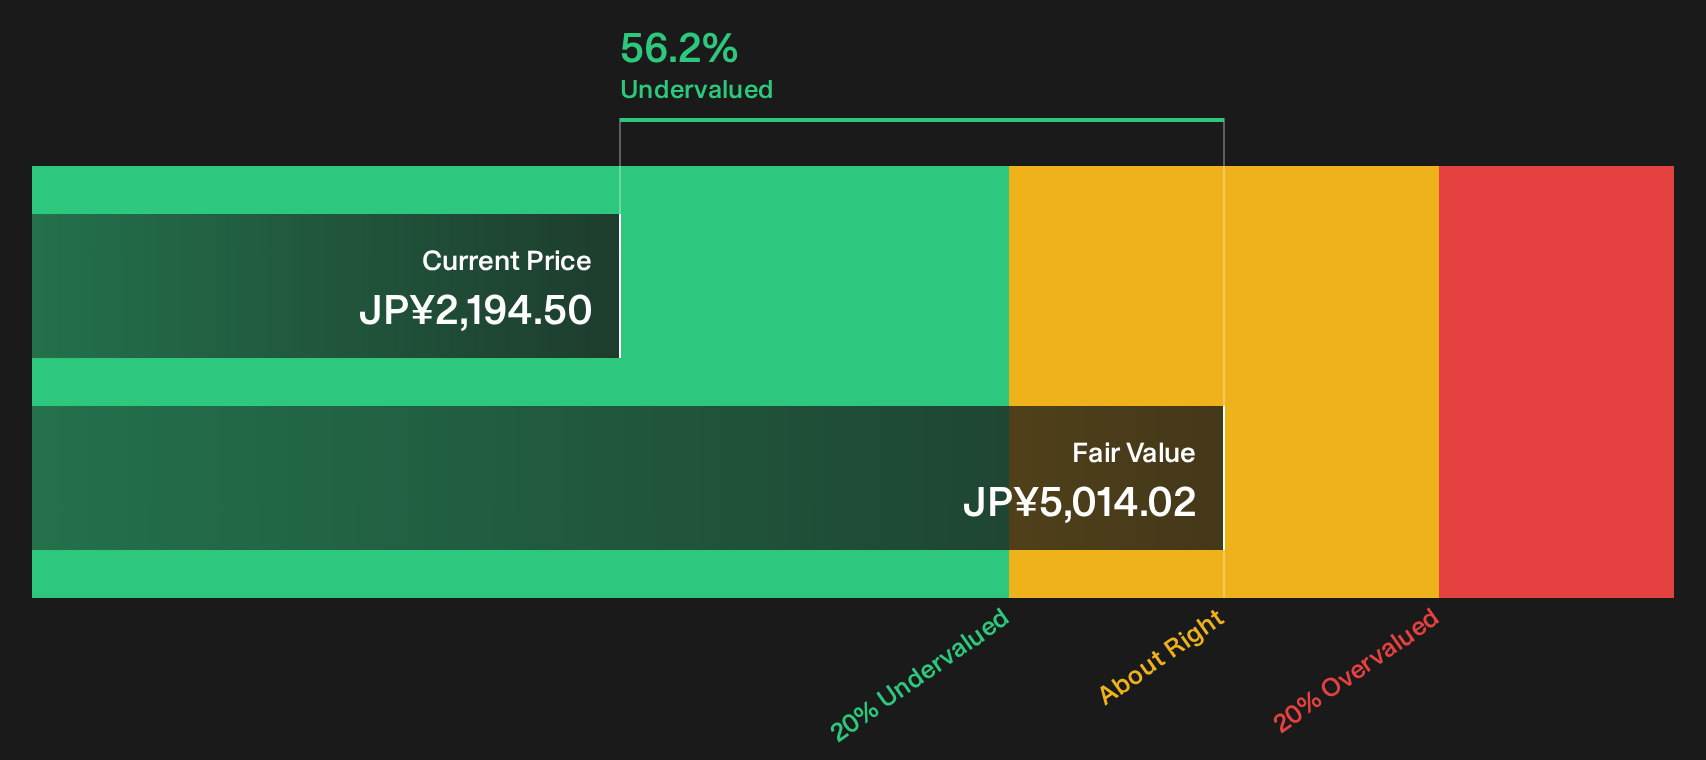
The P/E work paints Aisin as roughly fairly placed, yet the SWS DCF model points a different way. At ¥2,194.5, the stock is described as trading 56.2% below an estimated future cash flow value of ¥5,014.02. This suggests a much larger valuation gap. Which signal do you trust more when cash flows and earnings send different messages?
Look into how the SWS DCF model arrives at its fair value.
Simply Wall St performs a discounted cash flow (DCF) on every stock in the world every day (check out Aisin for example). We show the entire calculation in full. You can track the result in your watchlist or portfolio and be alerted when this changes, or use our stock screener to discover 21 high quality undervalued stocks. If you save a screener we even alert you when new companies match - so you never miss a potential opportunity.
Next Steps
Big swings in Aisin’s signals can feel confusing, so review the data yourself and decide how the risk reward trade off really looks. To weigh both sides in one place, start with the 2 key rewards and 1 important warning sign.
Looking for more investment ideas beyond Aisin?
If Aisin has sharpened your focus on value, do not stop here. Broader opportunities across sectors could suit different goals for growth, income or resilience.
- Spot potential bargains early by scanning companies that screen as mispriced on quality and value factors through the 21 high quality undervalued stocks.
- Strengthen portfolio resilience by filtering businesses with robust finances and clean balance sheets using the list of solid balance sheet and fundamentals (23 results).
- Hunt for underfollowed opportunities by reviewing the 73 high quality undiscovered gems before other investors start paying attention.
Have feedback on this article? Concerned about the content? Get in touch with us directly. Alternatively, email editorial-team@simplywallst.com