


EN
Post-WASDE Trade Setup: Corn and Soybeans Turn Higher While Wheat Faces Resistance
Walsh Pure Grain Technicals / Daily News/Pure Hedge Division
Tim Healy 11/10/2026
Post-WASDE Trade Setup: Corn and Soybeans Turn Higher While Wheat Faces Resistance
Ranking the Trends
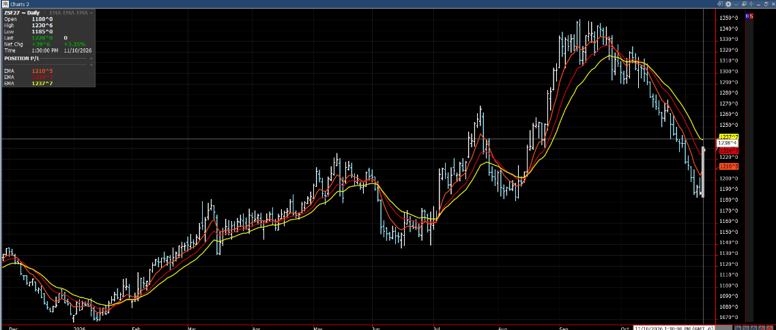
1. Soybeans: strongest reversal
Jan. soybeans closed at $12.28, above both the 7-day and 14-day EMAs, but still below the 21-day EMA.
- Close versus 7-day: +17.42 cents
- Close versus 14-day: +3.08 cents
- Close versus 21-day: -10.66 cents
- November 10 gain: 39’6 cents
- November 10 range: $11.85 to $12.30
The move above the 14-day EMA is positive, but the 21-day EMA near $12.38’6 is the major trend test.
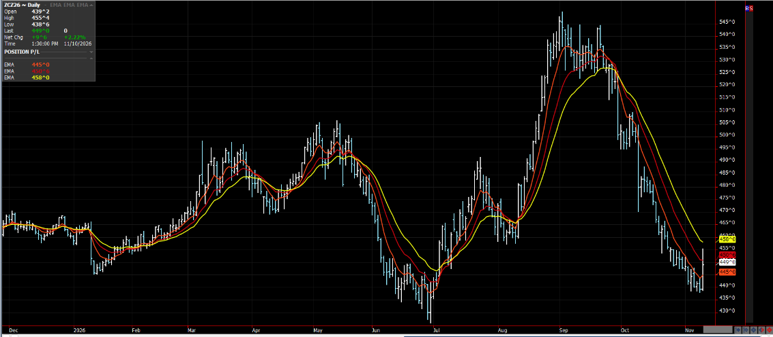
2. Corn: early recovery signal
Dec. corn closed at $4.49, above the 7-day EMA but below the 14- and 21-day EMAs.
- Close versus 7-day: +3.97 cents
- Close versus 14-day: -1.74 cents
- Close versus 21-day: -9.07 cents
- November 10 range: $4.38’6 to $4.55’2
The USDA-driven rebound improved momentum, but corn needs to clear $4.50’6, followed by $4.58, to demonstrate a broader reversal.
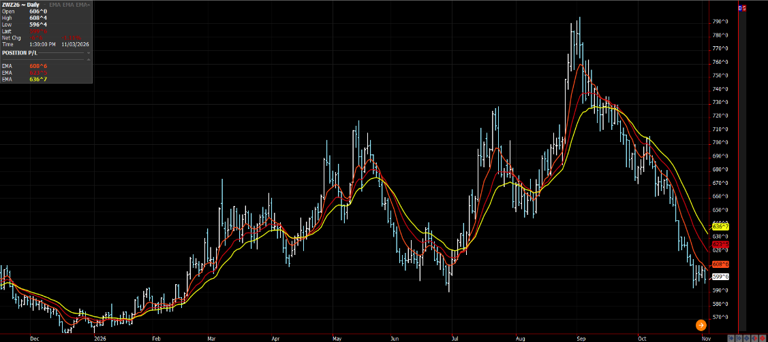
3. Wheat: weakest technical structure
Dec. wheat closed at $5.92’6, below all three EMAs.
- Close versus 7-day: -3.83 cents
- Close versus 14-day: -15.24 cents
- Close versus 21-day: -27.00 cents
- EMA order: 7-day below 14-day below 21-day
That remains a clearly bearish alignment. The November 10 bounce improved the immediate picture, but it did not reverse the downtrend.
Trade ideas
Corn: buy confirmation above the 14-day EMA
The bullish domestic USDA numbers support corn, but the chart has not fully confirmed a reversal. The best approach is to require follow-through rather than chase the initial report spike.
Bullish setup
- Entry: Buy a close above 451’0
- Stronger confirmation: Trade above 455’2, the November 10 high
- Initial stop: 442’0
- Target 1: 458’0, approximately the 21-day EMA
- Target 2: 463’0 to 466’0
- Target 3: 474’0, if short covering accelerates
Example using a 451’0 entry and 442’0 stop:
- Risk: 9 cents
- Corn contract value: $50 per cent
- Approximate risk: $450 per contract, excluding fees and commissions
- First target at 458’0: $350 potential gain
- Second target at 466’0: $750 potential gain
The first target alone does not produce favorable risk/reward, so this setup works better if part of the position is held for 463-0 or higher.
Bearish failure setup
- Trigger: Corn fails below 451 and closes back under 442-0
- Entry zone: 441’6 to 439’0
- Stop: 449’4
- Target 1: 432’0
- Target 2: 425’0
I believe corn is moderately bullish, but buy only on confirmation. Corn has the most supportive report fundamentals, while the moving averages show that overhead resistance is still present.
Soybeans: buy a successful retest or a breakout
Soybeans produced the strongest one-day reversal and regained the 14-day EMA. However, the market closed near the upper part of a wide report-day range, making an immediate purchase vulnerable to profit-taking.
Bullish pullback setup
- Entry: 1218’0 to 1225’0
- This area combines the breakout zone and the 14-day EMA near 1225-0
- Stop: 1202’0
- Target 1: 1238’6, the 21-day EMA
- Target 2: 1252’0
- Target 3: 1264’0 to 1268’0
Example using 1222‘0 entry and 1202’0 stop:
- Risk: 20 cents
- Soybean contract value: $50 per cent
- Approximate risk: $1,000 per contract
- Target at 1252’0: 30 cents, or approximately $1,500
- Target at 1264’0: 42 cents, or approximately $2,100
Bullish breakout setup
- Trigger: Trade above the November 10 high of 1230-0
- Better confirmation: Close above the 21-day EMA at approximately 1238-6
- Stop: 1217-0
- Target 1: 1252-0
- Target 2: 1264’0 to 1268-0
A close above 1238-6 would put soybeans above all three EMAs and materially improve the intermediate trend.
Bearish failure setup
- Trigger: Close back below 1202’0
- Stop: 1225’0
- Target 1: 1188’0
- Target 2: 1184’0 to 1185’0
Bullish on a controlled pullback into 1218-1225 or on a confirmed close above 1238’6. Avoid chasing directly after the nearly 40-cent report-day rally.
Wheat: I do favor selling resistance
Wheat rallied on November 10, but the close remained below the 7, 14, and 21-day EMAs. Wheat also faces the bearish increase in world ending stocks from the USDA report.
Preferred bearish setup
- Sell zone: 596’4 to 603’4
- This includes the 7-day EMA and recent closing resistance
- Stop: 610’4
- Target 1: 585’0
- Target 2: 575’0
- Target 3: 560’0, if the larger downtrend resumes
Example using a 600’0 entry and 610’4 stop:
- Risk: 10’4 cents
- Wheat contract value: $50 per cent
- Approximate risk: $525 per contract
- Target at 575'0: 25 cents, or approximately $1,250
- Reward-to-risk: approximately 2.4:1
Bullish reversal alternative
A bullish position becomes more attractive only if wheat begins closing above its declining EMAs.
- Initial trigger: Close above 608’0
- Stronger confirmation: Close above 620’0
- Stop: 596’0
- Target 1: 625’0
- Target 2: 643’0
Preferred wheat position
Sell rallies while below 608-0. Wheat has the weakest EMA structure and the least supportive USDA fundamental backdrop.
Best risk-adjusted ranking
- Sell wheat into 596-603 resistance
- Buy soybeans on a 1218-1225 retest
- Buy corn above 451, preferably with confirmation above 455’2

Tim Healy
Broker
Pure Hedge Division
Direct: 312 957 4731
WALSH TRADING INC.
311 S. Wacker Suite 540
Chicago, Illinois 60606
Walsh Trading, Inc. is registered as a Guaranteed Introducing Broker with the Commodity Futures Trading Commission and an NFA Member.
Futures and options trading involves substantial risk and is not suitable for all investors. Therefore, individuals should carefully consider their financial condition in deciding whether to trade. Option traders should be aware that the exercise of a long option will result in a futures position. The valuation of futures and options may fluctuate, and as a result, clients may lose more than their original investment. The information contained on this site is the opinion of the writer or was obtained from sources cited within the commentary. The impact on market prices due to seasonal or market cycles and current news events may already be reflected in market prices. PAST PERFORMANCE IS NOT NECESSARILY INDICATIVE OF FUTURE RESULTS.
All information, communications, publications, and reports, including this specific material, used and distributed by Walsh Trading, Inc. (“WTI”) shall be construed as a solicitation for entering into a derivatives transaction. WTI does not distribute research reports, employ research analysts, or maintain a research department as defined in CFTC Regulation 1.71.