


EN
Is Oki Electric Industry (TSE:6703) A Bargain Following Its Half Year Loss?
Oki Electric Industry (TSE:6703) drew attention after reporting half-year results to September 30, 2026, with higher sales of ¥188,643 million but a net loss of ¥3,516 million replacing last year’s profit.
The earnings setback has arrived after a choppy period for Oki Electric Industry’s stock, with a 1-day share price return of 6.46% and a 7-day share price gain of 4.00% contrasting with a 30-day share price decline of 5.47% and a 90-day drop of 11.65%. Longer term momentum remains strong, with a 1-year total shareholder return of 35.25% and a 3-year total shareholder return of 186.50%. This suggests sentiment has cooled in the short run but remains constructive over a multi year horizon.
Compare Oki Electric Industry's recent swing back into loss-making territory with peers by scanning 18 resilient stocks with low risk scores that have more resilient financial profiles and steadier return patterns.
Oki Electric Industry now trades well below both analyst targets and intrinsic value estimates after this setback. Is that discount justified by the loss, or does it overstate the damage to fair value?
Price-to-Earnings of 12.3x: Is it justified?
Oki Electric Industry closed at ¥2,473, and on a trailing P/E of 12.3x it screens as relatively inexpensive compared with both peers and internal fair value estimates, based on the data available.
The P/E ratio links what you pay today for each ¥1 of earnings that the business generates. For a diversified technology and electronics group like Oki Electric Industry, this measure often captures how the market weighs its earnings profile, capital intensity, and competitive position in areas such as telecom systems, printers, and industrial electronics.
Recent figures in the statements show several supportive data points sitting behind that 12.3x multiple. Earnings growth over the past year is reported at 62.9%, ahead of the 5 year average of 42.1% per year, and the stock is described as trading at what is presented as good value versus peers and the wider JP Electronic industry. Profitability has also moved in the reported direction, with net profit margins at 4% compared with 2.5% last year, while earnings are forecast to increase 12.85% per year, which is faster than the 9.2% growth forecast for the broader JP market. Against this backdrop, an estimated fair P/E of 17.3x is stated as sitting well above the current 12.3x level, which indicates the market could shift closer to that fair ratio if these fundamentals hold.
Compared with the JP Electronic industry average P/E of 13.5x, the Oki Electric Industry valuation is described as sitting at a clear discount, and the gap to the estimated fair P/E ratio of 17.3x is even wider. That combination suggests investors are paying less for each unit of earnings than both sector peers and the implied level that regression based fair value work indicates.
Explore the SWS fair ratio for Oki Electric Industry.
Result: Price-to-Earnings of 12.3x (UNDERVALUED)
Still, Oki Electric Industry faces clear risks if earnings slip again or if analyst and intrinsic value estimates prove too optimistic compared with future cash generation.
Find out about the key risks to this Oki Electric Industry narrative.
Another View on Oki Electric Industry’s Value
The earlier P/E work presents Oki Electric Industry as inexpensive. Using a different lens, our DCF model values the future cash flows at ¥6,991.52 per share, which is significantly higher than the current ¥2,473 price. That gap still suggests undervaluation. The key question is how comfortable you are with the cash flow assumptions behind this model.
Look into how the SWS DCF model arrives at its fair value.
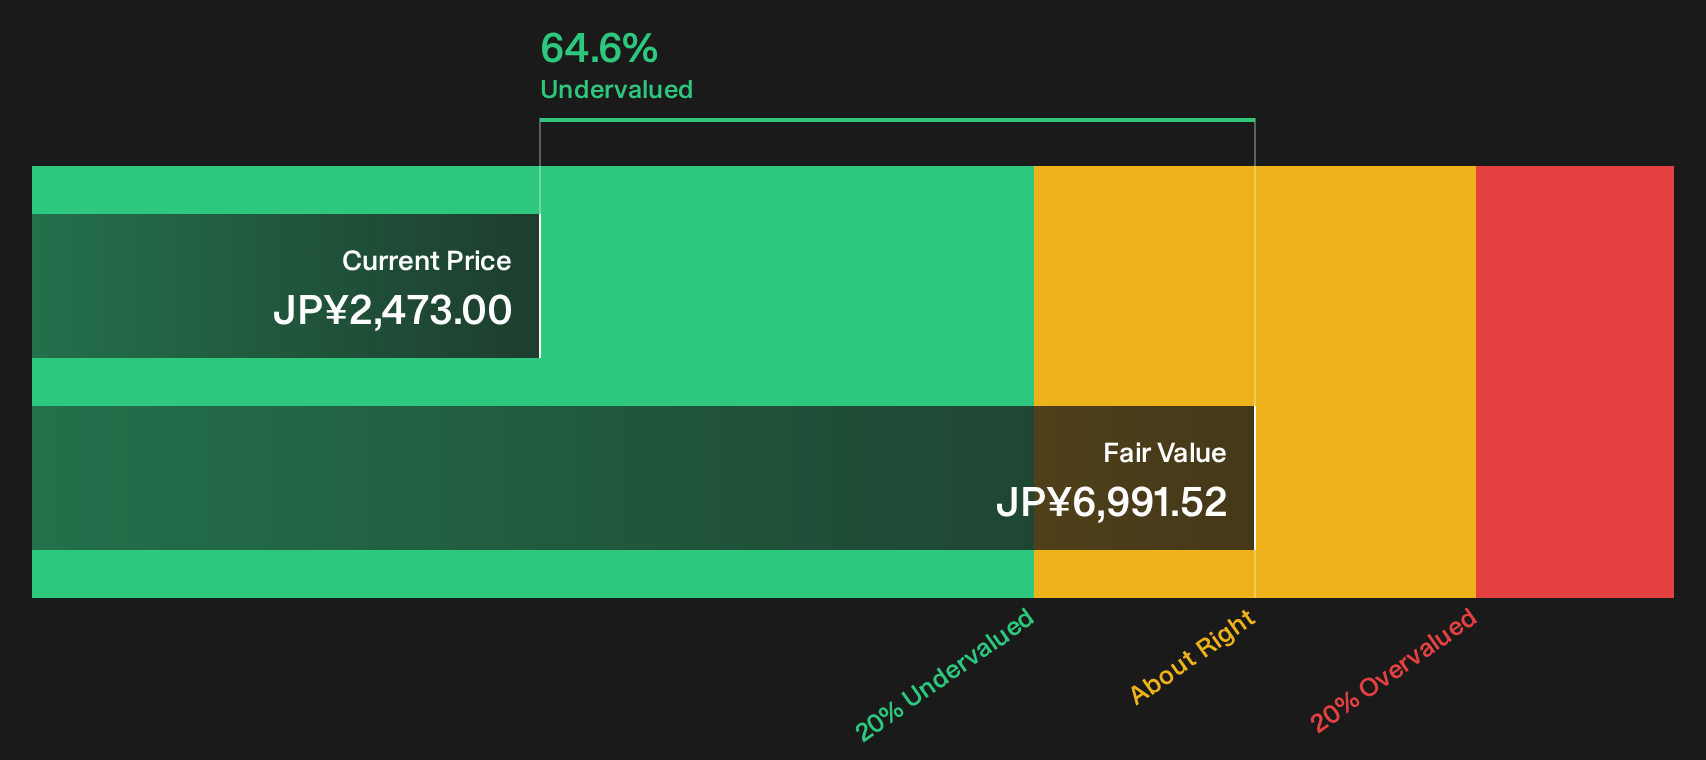
Simply Wall St performs a discounted cash flow (DCF) on every stock in the world every day (check out Oki Electric Industry for example). We show the entire calculation in full. You can track the result in your watchlist or portfolio and be alerted when this changes, or use our stock screener to discover 20 high quality undervalued stocks. If you save a screener we even alert you when new companies match - so you never miss a potential opportunity.
Next Steps
Plenty of signals on Oki Electric Industry point in different directions, so take this as a cue to act promptly, review the numbers yourself, and decide where you stand after weighing its 4 key rewards and 2 important warning signs
Looking for more investment ideas beyond Oki Electric Industry?
If Oki Electric Industry has you thinking carefully about value and risk, do not stop here. Broader ideas can sharpen your next move.
- Target companies that combine quality with attractive pricing by using the 20 high quality undervalued stocks before those opportunities narrow.
- Strengthen your defense with businesses that keep their finances in check through the list of solid balance sheet and fundamentals (23 results) so you are not caught off guard.
- Spot potential future leaders early by scanning the 76 high quality undiscovered gems while they are still off most investors' radar.
Have feedback on this article? Concerned about the content? Get in touch with us directly. Alternatively, email editorial-team@simplywallst.com