


EN
McDonald's Stock Is Up 24% in the Last Month - Is MCD Near a Peak?
McDonald's Corp. (MCD) stock hit a low of $230.88 about a month ago (Oct. 7) and since then has risen 24%. Is it at a peak? That's what the 6-month chart below from Barchart shows.
MCD closed up 1.78% on Monday, Nov. 9, at $281.44. The chart below shows that MCD is near its 6-month peaks.
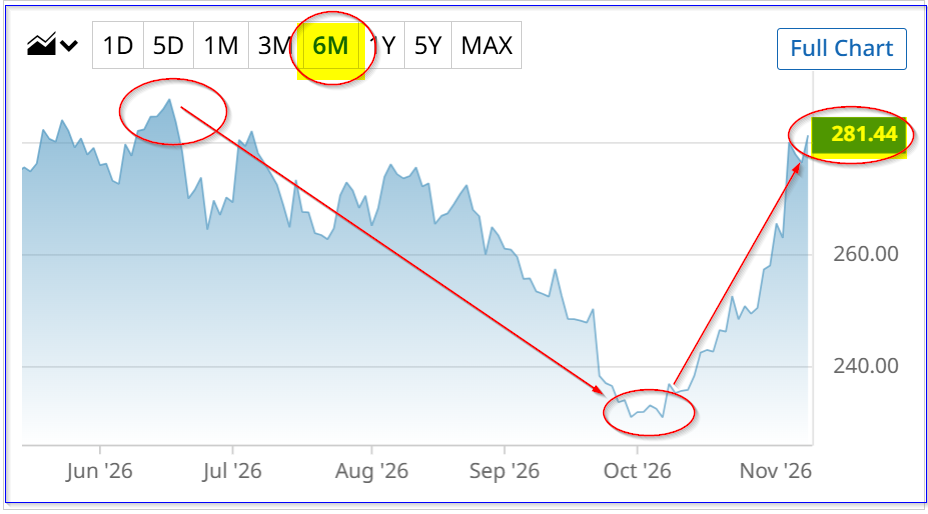
The prior 6-month peak price was $287.93 on June 16. So, does MCD stock have more upside?
McDonald's just released the Q3 10-Q. That shows its free cash flow (FCF) figures. They came out on Friday, Nov. 6 (two days after its Nov. 4 earnings release, without any cash flow data).
The bottom line is there's not much upside.
For example, analysts surveyed by Yahoo! Finance see 6.2% upside at $299.00, and Barchart's mean survey price target (PT) is $306.33 (+8.85%).
However, my estimate, based on its average FCF margins and FCF yields, as well as analysts' revenue forecasts, is only $286.79, or +1.9% higher. Let's see why.
Free Cash Flow Prospects
The 10Q showed that Q3 FCF was 11.17% lower than last year (see Stock Analysis data). Moreover, its quarterly FCF margin fell from over 34% last year to just 30% in Q3 this year.
The same happened with its trailing 12-month (TTM) FCF margins: they fell from 28.07% last year to just under 27.0% in Q3 this year. (The TTM figure is important as it accounts for seasonal changes in growth and margins.)
On top of this, revenue is not really on fire. It rose just 1% in Q3, and for all of 2026, it's projected to rise just 3.69% to $27.88 billion. However, over the past year, the TTM revenue has risen 5.78%. But that's down from last quarter, when TTM revenue rose 6.30%. So revenue growth is decelerating.
In fact, analysts project just 1.07% revenue growth over the coming year to $28.18 billion, up from $27.88 billion forecast for 2026.
This is important since FCF won't rise much as well. For example, here is a forecast for 2027:
$28.18 billion est. x 0.27 FCF margin = $7.61 billion FCF 2027
That is only 1.6% higher than the Q3 TTM FCF of $7.49 billion.
As a result, the fair value for MCD stock is not that high.
Fair Value for MCD Stock
Today, MCD stock has a market capitalization of $198.7 billion, but it's down 6.8% over the last year.
That means that FCF has averaged just 3.76% of its average market cap of $199.17 billion. In other words, we can use a 26.6x FCF multiple (i.e., 1/0.0376) to value MCD going forward:
$7.61 billion 2027 FCF est. x 26.6 = $202.5 billion valuation
But that's only $3.8 billion above its present market cap, i.e., +1.9% higher.
That implies a price target (PT) of just $286.79 per share. That's nothing to write home about.
So, what is the best MCD play here?
MCF Put Credit Spreads
Some investors might want to wait until MCF takes a breather here. After all, there is no guarantee that its Q4 earnings will do any better. And last quarter, the stock dipped a great deal mid-quarter.
Normally, I would suggest shorting out-of-the-money (OTM) puts. But it seems that it makes sense to wait for a potentially lower OTM short-put buy-in price.
However, for those willing to take on more risk, along with higher returns, doing a very short-term put credit spread could be profitable.
For example, the Dec. 4 expiry period, just over 3 weeks from now, shows the $260.00 put option contract has a midpoint premium of $0.82. And the $250 put, if bought, would cost $0.38.
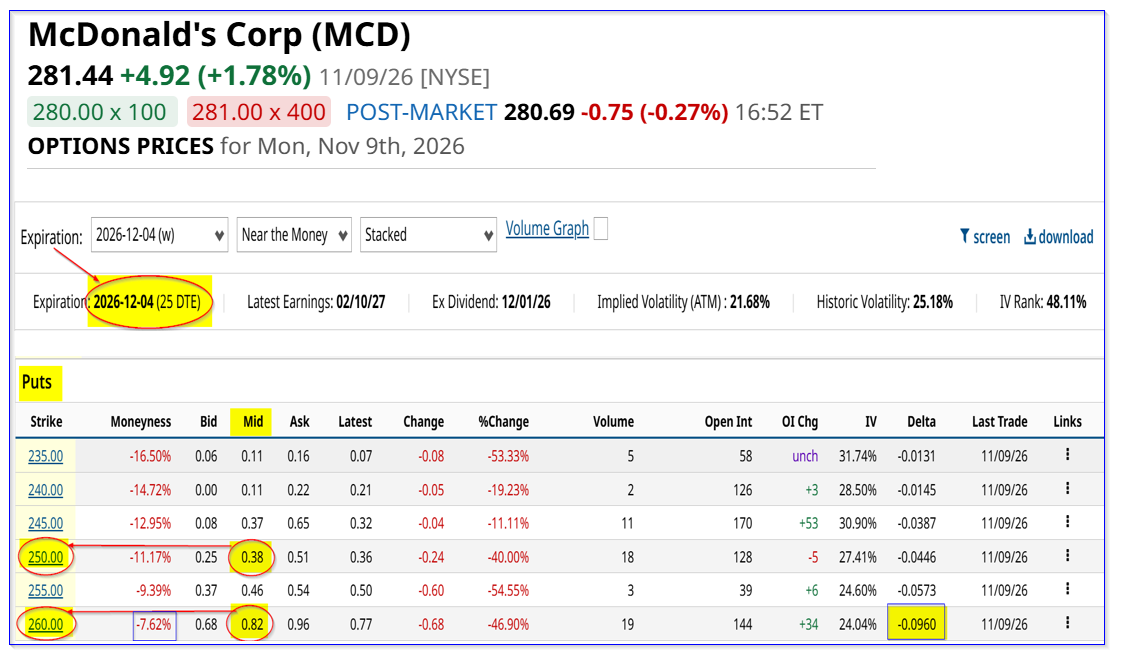
So, here is how that put credit spread works out:
Short the $260 put: $82 collected (delta ratio is -0.096, i.e., a 90%+ chance of success that MCD won't drop to $260 by Dec. 4)
Buy the $250 put: -$38 cost
Net Credit: $44 per put credit spread
$1,000 collateral (i.e., ($260 - $250) x 100): Therefore
At-Risk Capital: $1,000 - 44 = $956
Expected Return: $44/956 = 0.046 = 4.6% expected return
That is not that high a return, but keep in mind that the $260 put is over 7.6% out-of-the-money (OTM). This is a risky way to play MCD, given that 100% of the collateral could be lost. But at least it provides investors with some income, especially if they already are MCD shareholders.
On the date of publication, Mark R. Hake, CFA did not directly have a position in any of the securities mentioned in this article. All information and data in this article is solely for informational purposes. For more information please view the Barchart Disclosure Policy here.