


EN
American Airlines (AAL) Stock Looks Cheap Based On Its Sales
American Airlines Group has seen a mix of short term gains and longer term setbacks, which puts fresh attention on a simple question for investors who care about valuation. Is the current share price around US$14.16 well supported by the airline's sales profile.
- Over the past 5 years the stock has fallen 30.3%, so the market has already repriced American Airlines in a way that puts its sales base under the microscope.
- The planned Charlotte airport lease, which could enable up to US$2.1b of projects tied to American Airlines' second largest hub, may support expectations for future route capacity and ticket revenue.
- There is a second opinion on American Airlines Group worth weighing. See what analysts think American Airlines Group's shares could be worth.
The issue now is whether American Airlines Group's current valuation can be squared with what investors are paying for its sales today.
If you want to test the same sales-based valuation question beyond American Airlines Group, compare it with companies filtered through 33 high quality undervalued stocks
Is American Airlines Group a Bargain on Sales?
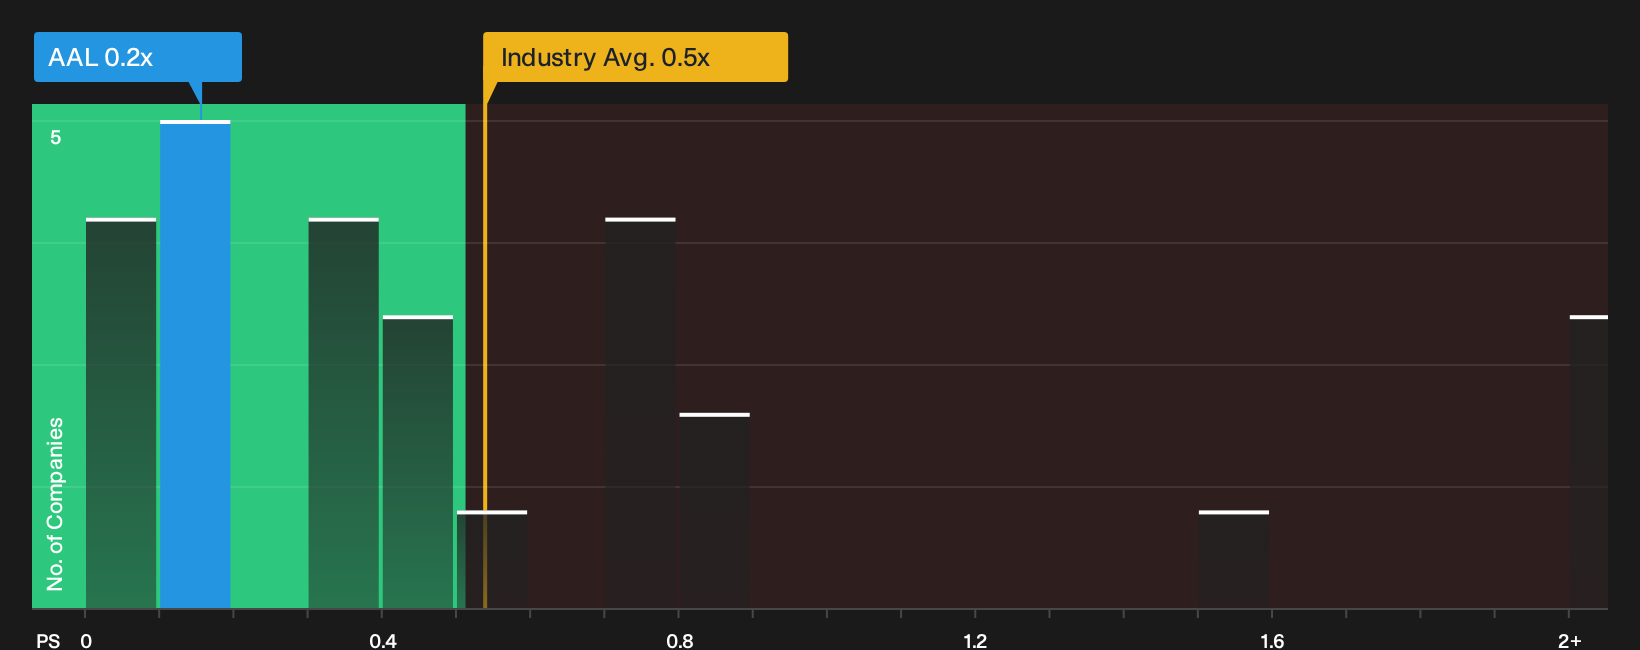
P/S fits American Airlines Group because investors often focus on revenue capacity and route footprint when earnings move around. On this measure, the shares trade at a P/S of about 0.2x, which sits well below the Airlines industry average of roughly 0.5x and the peer group closer to 0.8x. That gap indicates the market currently pays much less for each dollar of American Airlines Group sales compared with many rivals in the sector.
The fair multiple model, which compares the stock with what might be expected given its margins, size, industry and risk profile, also places the current 0.2x P/S below its implied level, so American Airlines Group screens as undervalued on this basis. Because the proposed Charlotte airport lease could expand American Airlines Group's hub capacity, the low P/S means the stock still prices its revenue base at a discount even with that project under consideration. Explore the numbers behind American Airlines Group's P/S valuation.
The American Airlines Group Narrative: What Would Justify Today's Price?
Simply Wall St Narratives continue where the P/S puzzle for American Airlines Group leaves off, by spelling out which paths for future growth, margins and earnings would need to play out for the shares to look materially higher or lower than today’s price. Each scenario links a fair value estimate to a clear storyline about American Airlines Group's potential catalysts and key risks, so you can monitor which version gradually aligns with reality over time.
Bullish and bearish Narratives on American Airlines Group focus on the same premium and fuel story, yet reach very different conclusions on what investors are paying for.
Bull case: 8% undervalued
This view comes from the analyst consensus Narrative on Simply Wall St, which folds in Street forecasts and price targets.
"The current valuation suggests the market is significantly discounting American Airlines Group’s ability to translate higher premium and loyalty cash flows and cost efficiencies into future earnings…"
Discover why this Narrative puts American Airlines Group at 8% undervalued.
Bear case: 72% overvalued
This angle is drawn from the bearish analyst Narrative on Simply Wall St, which leans on the most cautious targets and assumptions.
"The figures on fuel headwinds, guidance cuts to roughly break-even EPS, and a still highly leveraged balance sheet suggest a share price that already reflects a recovery…"
Explore why this Narrative puts American Airlines Group at 72% overvalued.
The valuation for American Airlines Group still leaves one crucial angle unexplored
All the current ratios tell you what investors pay for American Airlines Group today, but analyst expectations a few years out add a different lens on what that pricing might be pointing toward. Explore where analysts expect American Airlines Group to be in a few years.
Have feedback on this article? Concerned about the content? Get in touch with us directly. Alternatively, email editorial-team@simplywallst.com