


EN
Earnings Guidance Lift Could Be A Game Changer For Hulic Stock (TSE:3003)
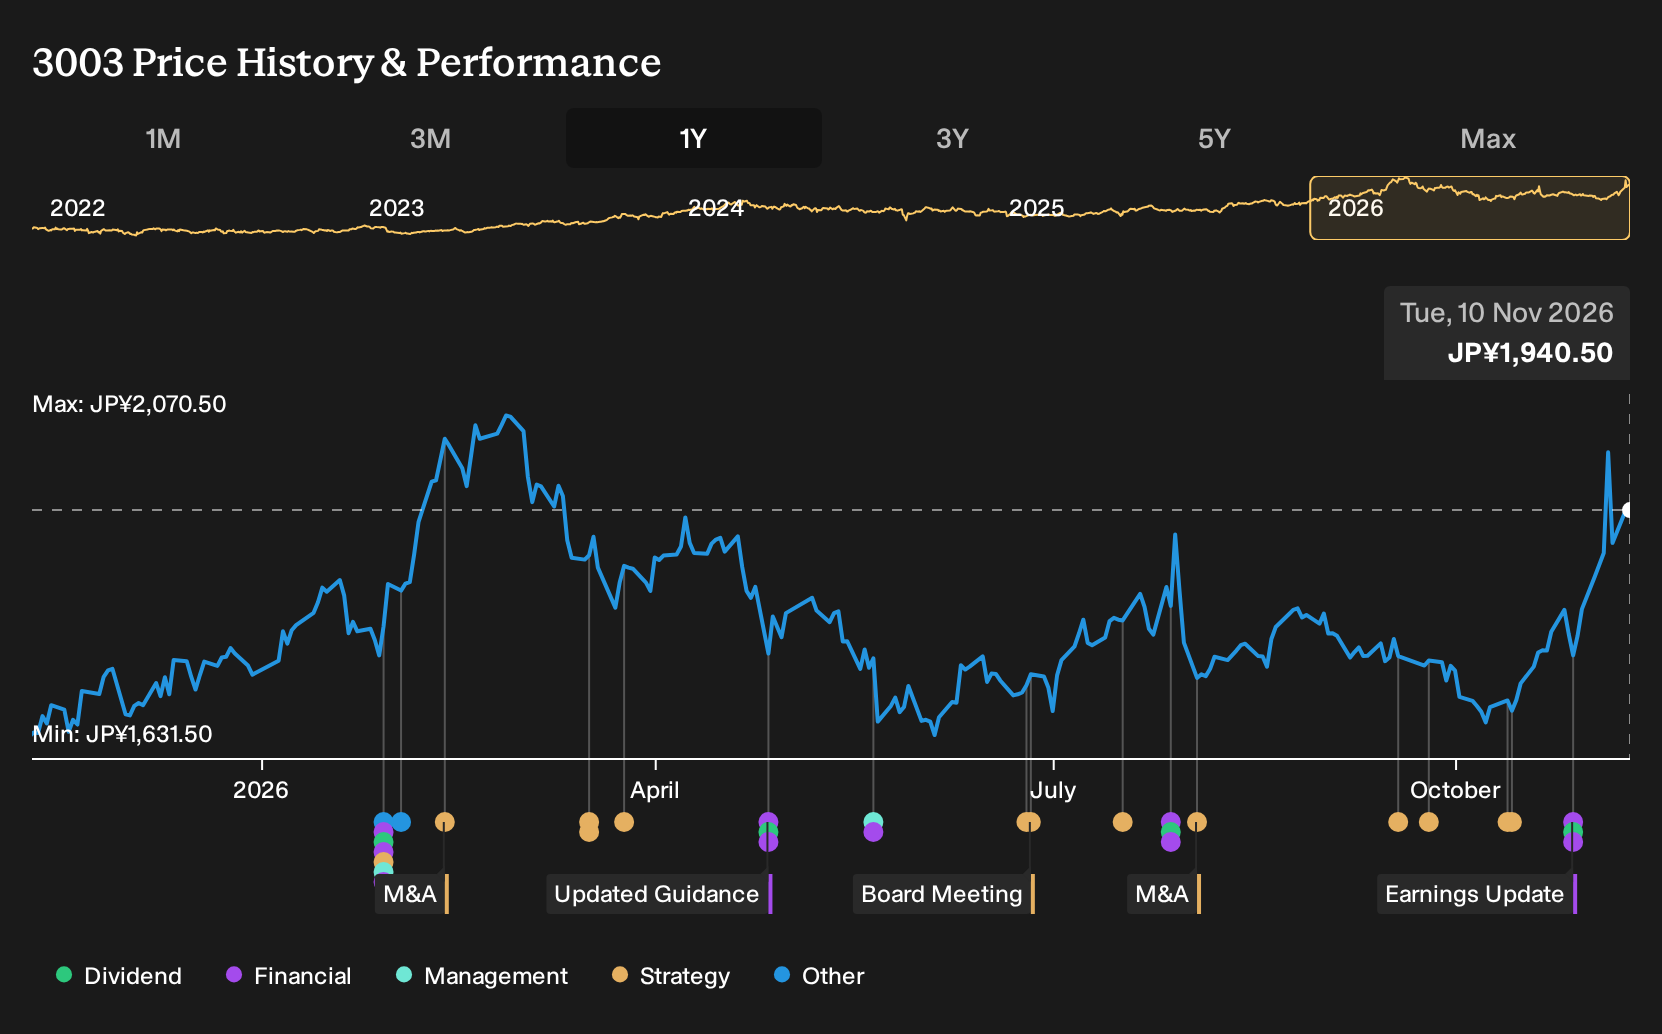
- Hulic raised its 2026 full-year guidance after reporting nine-month sales of JPY 574,725 million and net income of JPY 69,470 million, and now projects record profit items alongside a higher year-end dividend of JPY 36.50 per share.
- The real estate group is reshaping its portfolio by selling assets that no longer fit its holding criteria in order to concentrate on higher-quality leasing properties, while committing to lift its payout ratio toward 45% by 2029 in stages.
- Next, the focus turns to Hulic's broader investment narrative and how the upgraded profit outlook may reshape the risk-reward profile for shareholders.
What Is Hulic's Investment Narrative?
The big belief with Hulic is that you are backing a real estate operator that is willing to recycle capital aggressively rather than cling to every building forever. The raised 2026 guidance, built on selling properties that no longer match its criteria and on a leasing portfolio tilted toward higher quality assets, reinforces that this is an execution story. In the short term, the key swing factors are how cleanly those disposals flow through earnings, how stable leasing demand and pricing stay around the core portfolio, and whether Hulic can keep capex and construction commitments aligned with that JPY 900,000 million revenue plan.
Dividend policy sits right next to that operational story. Management is lifting the year end dividend to JPY 36.50 per share and still talking about a payout ratio heading toward 45% by 2029, even though past analysis flagged free cash flow coverage and debt relative to operating cash flow as pressure points. The updated outlook nudges earnings higher, which helps, but it also raises the bar for cash generation and balance sheet discipline if Hulic wants this higher distribution profile to feel comfortable across a full cycle.
Yet there is a lingering concern around Hulic that only really comes into focus once you look closely at ...
There's only one way to know the right time to buy, sell or hold Hulic. Head to Simply Wall St's company report for the latest analysis of Hulic's Fair Value.
Exploring Other Perspectives
Two fair value estimates from the Simply Wall St Community sit far apart, from about JPY 188.40 to JPY 2,010 a share. This shows how wide opinion on Hulic can run. These views were formed before the upgraded 2026 profit and dividend guidance, so you should compare them with fresh news and seek out more angles.
Explore another Hulic fair value estimate, including one that suggests there could be as much as 90% downside from the current price.
The Verdict Is Yours
Disagree with this assessment? Extraordinary investment returns rarely come from following the herd, so go with your instincts.
- A great starting point for your Hulic research is our analysis highlighting 3 key rewards and 2 important warning signs that could impact your investment decision.
- See our latest analysis for Hulic. The report includes a comprehensive fundamental analysis summarized in a single visual, the Snowflake, making it easy to evaluate Hulic's overall financial health at a glance.
Looking For More Ideas Beyond Hulic?
If Hulic has sharpened your focus on balance sheets, cash generation, and shareholder returns, it can be useful to widen the lens and compare it with other businesses that share similar qualities. The Simply Wall St Screener lets you filter for traits that match your own risk tolerance and income needs rather than relying on a single story.
- If you prioritize resilient business models and want to dial back volatility, start with a group of companies screened as 18 resilient stocks with low risk scores that may offer a smoother ride through different market conditions.
- For investors who care most about steady income and payout durability, take a look at potential 27 dividend fortresses that focus on meaningful yield backed by underlying fundamentals.
- If your goal is to back strong balance sheets and solid fundamentals without overpaying, use the screener to surface a list of solid balance sheet and fundamentals (23 results) that meet your quality and valuation checks.
Have feedback on this article? Concerned about the content? Get in touch with us directly. Alternatively, email editorial-team@simplywallst.com