


EN
TISI (TSE:3626) Climbed, So What Is Behind The Latest Attention?
TISI (TSE:3626) drew investor attention after raising its full year earnings outlook and dividend forecast alongside half year results, tying capital returns directly to current business momentum and order conditions.
Recent trading shows that TISI’s share price has been rebuilding some momentum, with a 1-day share price return of 3.04% and a 90-day share price return of 12.64%. This comes even though the year-to-date share price return has declined 18.08% and the 1-year total shareholder return has fallen 12.18%. At the same time, the 3-year total shareholder return of 51.04% and 5-year total shareholder return of 36.35% point to a much stronger longer run picture behind the latest earnings, guidance and dividend news.
Scan beyond TISI and compare its earnings and dividend momentum with a curated group of IT and fintech peers using the 22 high quality undervalued stocks as a starting universe.
Bulls see TISI’s upgraded outlook and richer dividend as evidence that the recent share price recovery has more room to run. Bears point to the weaker 1 year return and question whether the valuation already reflects the good news.
Preferred P/E of 17.9x for TISI: Is it justified?
TISI closed at ¥4,241 with the shares trading on a P/E of 17.9x, which screens as good value against some benchmarks yet looks expensive against others.
The P/E multiple reflects how much investors are paying today for each unit of current earnings, which is especially watched for mature IT service providers with steady but moderate growth expectations.
On one side, the stock is described as good value based on its P/E of 17.9x compared with an estimated fair P/E of 24.4x and also against a peer average of 22.5x. This gap suggests the market is assigning a lower earnings multiple than those frameworks indicate could be reasonable.
On the other side, the same P/E of 17.9x is described as expensive compared with the broader JP IT industry on 14.9x. This signals investors are still paying a premium versus the sector even though TISI’s most recent year of earnings declined and its forecast earnings and revenue growth are slower than both the IT industry and the wider JP market.
Explore the SWS fair ratio for TISI.
Result: Preferred multiple of 17.9x P/E (ABOUT RIGHT)
Still, the softer 1-year return and slower forecast earnings and revenue trends versus the wider JP IT sector could quickly pressure TISI if sentiment turns.
Find out about the key risks to this TISI narrative.
Another View on TISI: Cash Flows Tell a Different Story
The P/E suggests TISI is roughly fairly priced, yet the SWS DCF model points to something different. At ¥4,241, the shares trade about 19% below an estimated future cash flow value of ¥5,253.01.
Look into how the SWS DCF model arrives at its fair value.
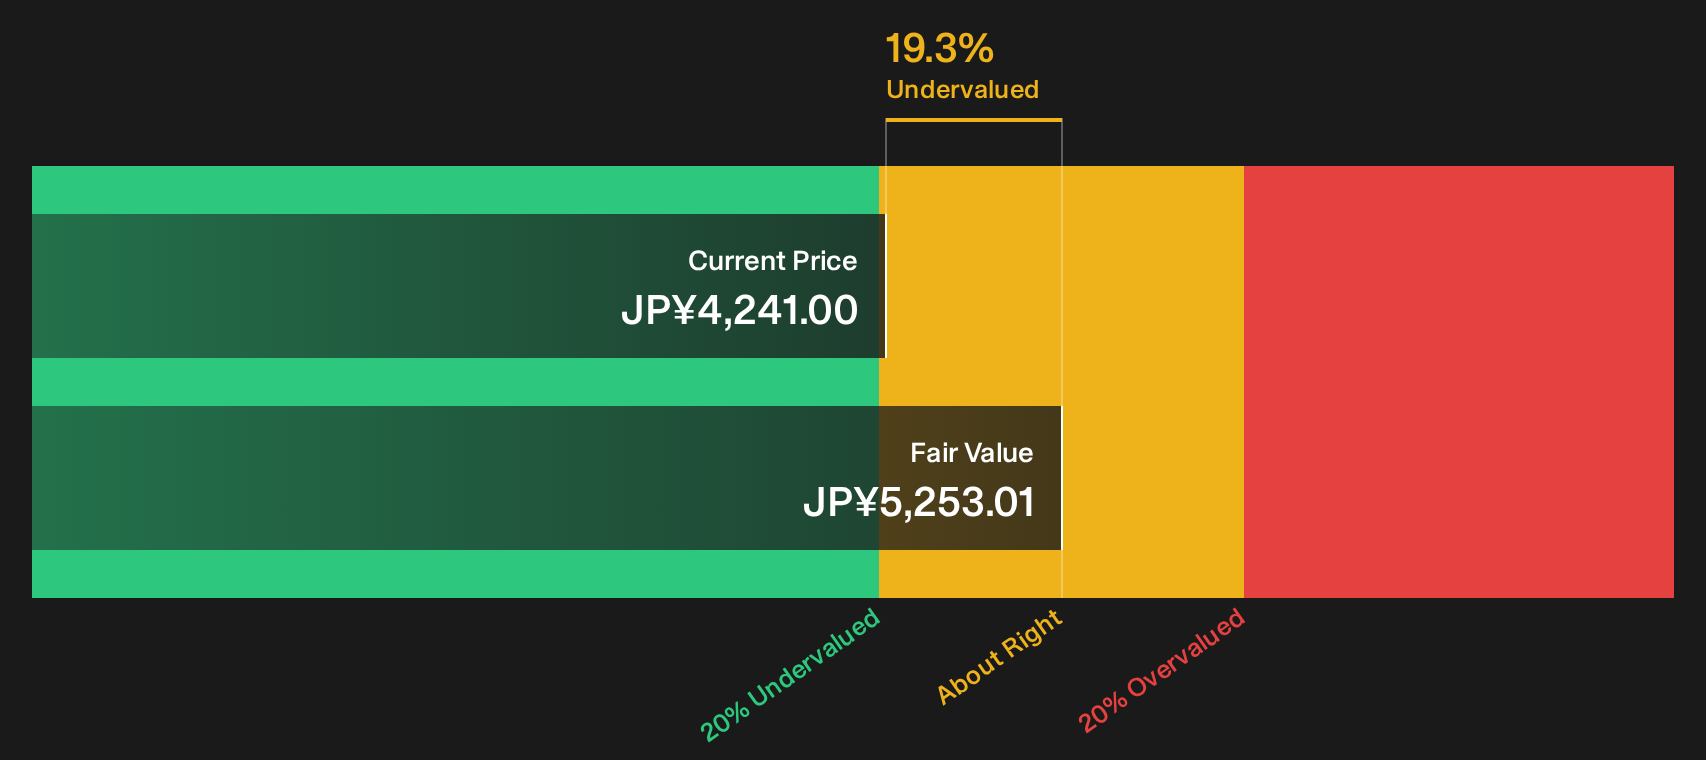
Simply Wall St performs a discounted cash flow (DCF) on every stock in the world every day (check out TISI for example). We show the entire calculation in full. You can track the result in your watchlist or portfolio and be alerted when this changes, or use our stock screener to discover 22 high quality undervalued stocks. If you save a screener we even alert you when new companies match - so you never miss a potential opportunity.
Next Steps
Mixed signals on TISI’s valuation and cash flow story only matter if they change how you act. Review the numbers, compare the scenarios, and pressure test your own thesis with the 3 key rewards
Looking for more TISI investment ideas?
If TISI has sharpened your focus on valuation and earnings quality, do not stop here. The next step is widening your opportunity set with targeted screeners built to surface specific types of companies.
- Hunt for mispriced quality by scanning the 22 high quality undervalued stocks that combine strong fundamentals with appealing entry points.
- Prioritize resilience by using the list of solid balance sheet and fundamentals (23 results) to spot businesses with sturdier finances that can better handle shocks.
- Get early to potential future leaders by reviewing the 76 high quality undiscovered gems before they land on everyone else's radar.
Have feedback on this article? Concerned about the content? Get in touch with us directly. Alternatively, email editorial-team@simplywallst.com