


EN
BSP Financial Group (ASX:BFL) Following Third Quarter Results Is The Valuation Discount Warranted
BSP Financial Group (ASX:BFL) put fresh numbers on the table with its third quarter 2026 earnings update, reporting PGK 619 million in net interest income and PGK 334 million in net profit.
At a share price of A$7.80, BSP Financial Group has drifted lower in recent months, with the share price return down over the quarter and year to date, even as total shareholder return over 1, 3 and 5 years has been strongly positive. This hints that investors are reassessing near term risk while still recognising the longer term story.
Spot potential banking peers moving through similar earnings cycles by scanning our curated list of list of solid balance sheet and fundamentals (12 results) alongside BSP Financial Group today.
The recent slide in BSP Financial Group’s share price could mirror changing expectations about the bank’s earnings power, or it could simply reflect cooler sentiment after a strong multi year run. The valuation section tests which explanation fits better.
Preferred P/E of 8.7x: Is it justified?
BSP Financial Group trades on a P/E of 8.7x at a last close of A$7.80, a level that sits well below both domestic and global banking peers based on the data provided.
The P/E ratio compares the share price to earnings per share. For banks such as BSP Financial Group, it gives a rough sense of how much investors are willing to pay for each unit of current profit. This can reflect views on risk, growth durability and return on equity.
BSP Financial Group has reported earnings growth of 10.9% over the past year and 3.3% per year over five years, coupled with a high return on equity of 23.9% and an assessment of high quality earnings. In that context, a value score of 2 and a share price that sits above an internal future cash flow value estimate of A$5.91 indicate that not every valuation lens lines up. This may help explain why the multiple is not higher despite solid profitability metrics.
The gap to peers is clear. BSP Financial Group trades on a P/E of 8.7x compared with 10.9x for the global banks industry and 13.4x for its peer group average, and also below the broader Australian market at 16.8x. This suggests the market is applying a discount to the stock relative to both its sector and the wider market.
See what the numbers say about this price — find out in our valuation breakdown.
Result: Price-to-earnings of 8.7x (UNDERVALUED).
Still, the BSP Financial Group story can change quickly if regional credit conditions tighten or if any of its Pacific markets experience sharper economic stress.
Find out about the key risks to this BSP Financial Group narrative.
Another view on BSP Financial Group’s value
The P/E argument suggests BSP Financial Group looks inexpensive, yet the SWS DCF model points the other way. At A$7.80, the share price sits above an internal future cash flow value estimate of A$5.91, which frames the stock as overvalued on this approach and raises questions about how durable current earnings really are.
Look into how the SWS DCF model arrives at its fair value.
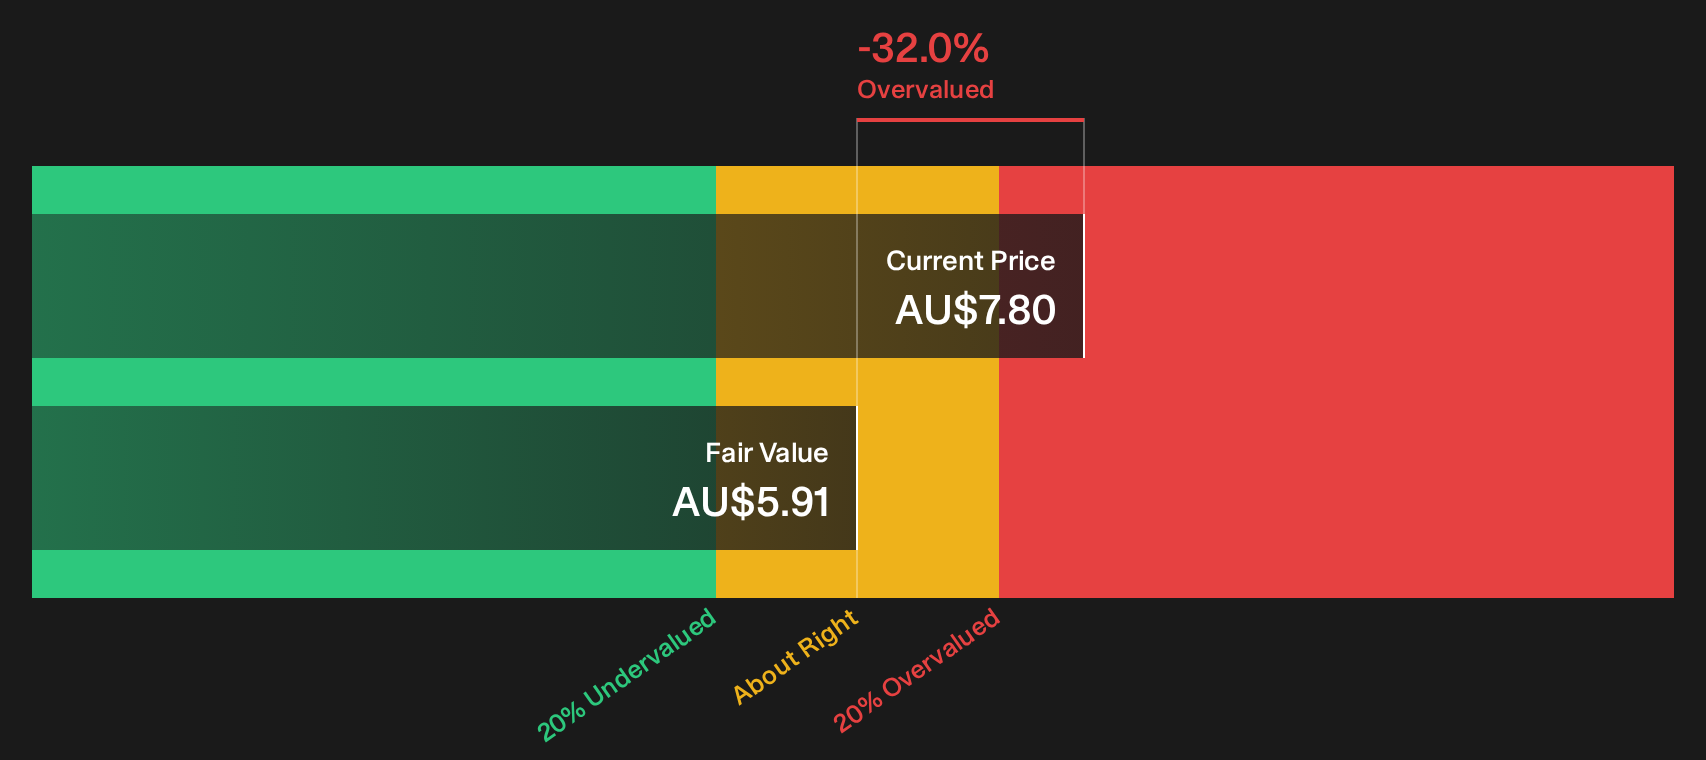
Simply Wall St performs a discounted cash flow (DCF) on every stock in the world every day (check out BSP Financial Group for example). We show the entire calculation in full. You can track the result in your watchlist or portfolio and be alerted when this changes, or use our stock screener to discover 2 high quality undervalued stocks. If you save a screener we even alert you when new companies match - so you never miss a potential opportunity.
Next Steps
If the mixed signals around BSP Financial Group leave you on the fence, get straight into the numbers, weigh the upside and the red flags, and anchor your own view with 2 key rewards and 2 important warning signs.
Looking for more BSP Financial Group sized investment ideas?
If BSP Financial Group has sharpened your focus on valuation and risk, broaden your watchlist today with a few carefully filtered ideas that match your style.
- Target resilient compounding potential by scanning companies flagged as 2 high quality undervalued stocks with quality fundamentals already reflected in the financials.
- Strengthen income potential by reviewing 4 dividend fortresses that combine higher yields with an emphasis on durability.
- Prioritise capital preservation by focusing on 6 resilient stocks with low risk scores that score well on balance sheet strength and risk controls.
Have feedback on this article? Concerned about the content? Get in touch with us directly. Alternatively, email editorial-team@simplywallst.com