


EN
Wayfair (W) Stock Trades At A Premium To Sales Peers
Wayfair has delivered a powerful three year share price swing, which puts a spotlight on whether today’s US$111.74 level is still grounded in what its sales can reasonably support. With fresh profitability and higher revenue in focus, the stock now raises a clear question about how much investors are paying for each dollar the retailer brings in.
- The share price has climbed 170.6% over the past three years, so anyone looking at Wayfair now is effectively judging whether that move has already priced in what its sales can justify.
- Recent revenue growth and a return to profit suggest the business model can convert more of its sales into earnings, which may support investors placing a richer value on every dollar of merchandise sold.
- The analysts covering Wayfair have run their own numbers. See what analysts think Wayfair's shares could be worth.
The issue now is whether the current US$111.74 share price fairly reflects Wayfair’s value when viewed purely through the lens of its sales.
If you are comparing Wayfair with other retailers that also trade based on what their sales might justify, it can help to scan a wider field using 40 high quality undervalued stocks
Is Wayfair Getting Expensive on Sales?
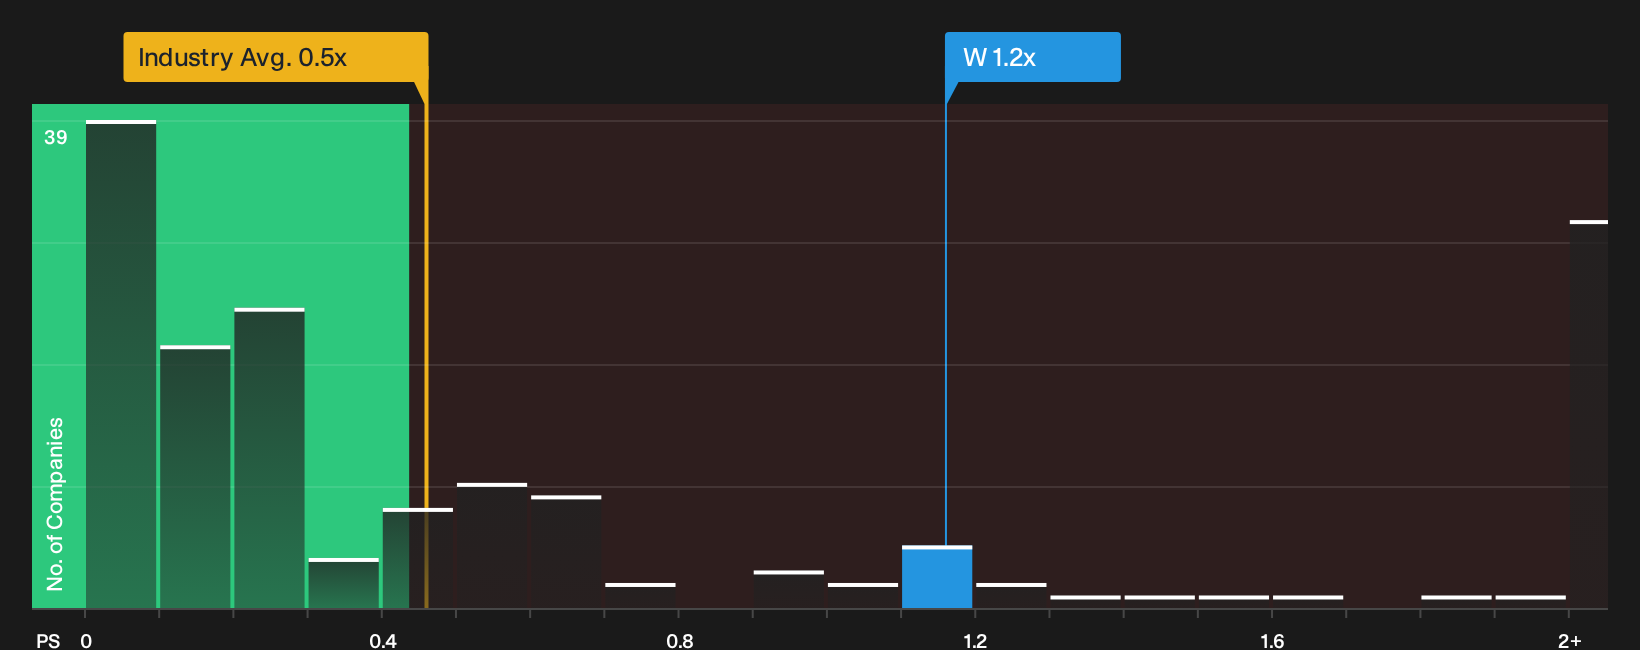
P/S works well for Wayfair because investors can relate the share price directly to the retailer’s revenue base, even when earnings are still normalising. At roughly 1.2x P/S, the stock trades above the broader Specialty Retail industry on this yardstick, where the typical peer sits closer to 0.5x. Against a more focused peer set, the gap narrows, with comparable companies around 1.7x.
The Fair Ratio model, which adjusts the benchmark multiple for factors like growth profile, profitability, size and risk, points to a lower P/S than where Wayfair trades today, so the shares screen overvalued on this metric. Because the latest quarterly update flagged stronger post pandemic Q3 revenue and a move back into profit, the current premium suggests investors are already paying up for that momentum and expecting those fundamentals to hold up. For anyone weighing Wayfair at today’s level, the key question is whether its long term revenue mix and margin structure can justify paying more than both the Fair Ratio yardstick and the sector average on each dollar of sales. Explore the numbers behind Wayfair's P/S valuation.
The Wayfair Narrative: What Would Justify Today's Price?
Simply Wall St Narratives pick up where the P/S puzzle leaves off for Wayfair by spelling out which revenue growth, margin and earnings paths would need to hold for the stock to be worth meaningfully more or less than it is today. Rather than a single multiple or model snapshot, each narrative lays out the specific assumptions behind a fair value view so you can compare those expectations with the company’s reported results over time on the Community page.
Wayfair now splits analysts into two camps, with one seeing meaningful upside from stores and logistics and the other worrying that today’s price already bakes that in.
Bull case: 30% undervalued
This view comes from the bullish analyst Narrative on Simply Wall St, which leans heavily on stores, logistics and AI as long term drivers.
"The rapid roll out of large format Wayfair stores across multiple U.S. metros through 2028, with roughly half of store visitors being new customers and existing local customers lifting and sustaining higher spend after a visit, creates an underappreciated path for higher regional revenue density and better fixed cost absorption..."
Discover why this Narrative puts Wayfair at 30% undervalued.
Bear case: 27% overvalued
The cautious view comes from the bearish analyst Narrative on Simply Wall St, which focuses on category softness and margin strain.
"Although Wayfair is investing heavily in live sports advertising and new AI partnerships to support customer acquisition, the risk remains that incremental spend fails to offset a home category that management describes as depressed..."
Explore why this Narrative puts Wayfair at 27% overvalued.
One more angle on Wayfair that could shift how you see today’s price
Everything here has focused on what Wayfair looks like right now, yet there is a separate set of expectations for where this retailer might be a few years from today that could change your frame completely. Explore where analysts expect Wayfair to be in a few years.
Have feedback on this article? Concerned about the content? Get in touch with us directly. Alternatively, email editorial-team@simplywallst.com