


EN
How Investors May Respond To Berkshire Hathaway (BRK.A) Earnings Pressure
- Berkshire Hathaway reported Q3 2026 revenue of US$105.6b and net income of US$22.1b, with operating and insurance earnings under pressure, while completing US$9.6b of share repurchases and formalizing Greg Abel as Warren Buffett's operational successor.
- The combination of softer insurance profitability, record buybacks and a clarified leadership handover gives investors a clearer view of how Berkshire Hathaway is balancing capital returns, underwriting discipline and succession planning.
- We will look at how weaker insurance earnings and a record quarter of share repurchases are reshaping Berkshire Hathaway's investment narrative.
Berkshire Hathaway Investment Narrative Recap
To own Berkshire Hathaway, you need to be comfortable with a sprawling operating mix where insurance volatility, rail and utilities performance, housing exposure and large equity holdings all pull earnings in different directions. Q3 fits that picture. Revenue reached US$105.6b, but net income of US$22.1b was lower than a year ago and operating profit felt the squeeze from softer insurance results.
The near term swing factor is still insurance and investment income on that float. A 5.8% decline in operating earnings and a 43% hit to underwriting profit keep that segment under scrutiny. The biggest risk right now is that this pressure persists while AI driven power demand, housing additions and international insurance expansion take time to feed meaningfully into group results.
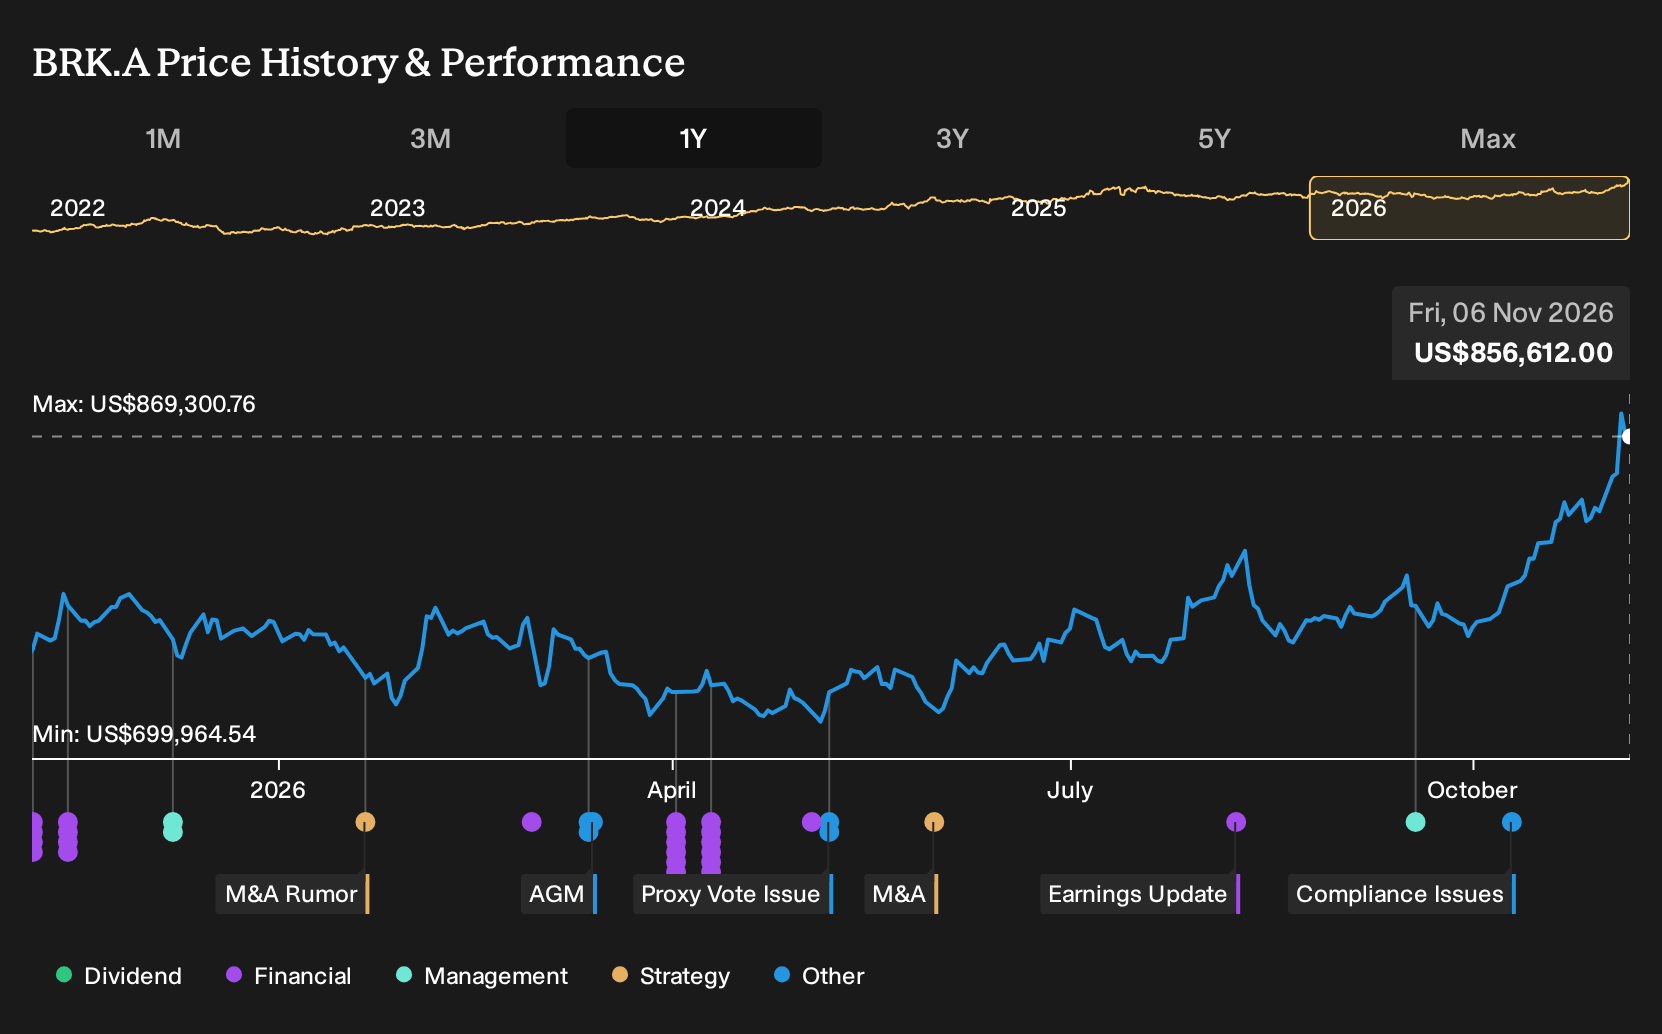
The analyst consensus Narrative on Simply Wall St leans heavily on Berkshire Hathaway maintaining its culture under Greg Abel while benefiting gradually from utilities, housing and long duration equity stakes. Against that backdrop, the Q3 2026 report is central. It shows revenue of US$105.6b, net income of US$22.1b and a record US$9.6b buyback in a single quarter.
That combination matters for catalysts and risks investors are already watching. Earnings pressure in insurance sits alongside a record US$377.4b cash pile, a completed US$6.8b Taylor Morrison deal and expanding specialty insurance offerings. Execution from Abel’s relatively new management team, and how consistently that cash is deployed versus returned, now sits right next to underwriting quality as the key thing to track.
Berkshire Hathaway's current assumptions point to revenue of US$448.5b and earnings of US$53.1b by 2029, based on analysts expecting 5.3% yearly revenue growth and a reduction in earnings of US$32.7b from US$85.8b today.
Uncover how Berkshire Hathaway's fair value indicates a 7% potential downside to its current price, leaving little room for error.
Exploring Other Perspectives
Four fair value estimates from the Simply Wall St Community put Berkshire Hathaway between about US$799,503 and US$1,172,449 per share equivalent, a huge spread that signals very different expectations. Some community members focus on succession and capital allocation risk, while others lean on cash reserves and diversified earnings. Use these contrasting viewpoints to stress test your own thesis.
Explore 3 other Berkshire Hathaway fair value estimates, including one that suggests as much as 7% downside from the current price.
The Verdict Is Yours
Don't just follow the ticker; dig into the data and build a conviction that's truly your own.
- A great starting point for your Berkshire Hathaway research is our analysis highlighting 2 key rewards and 1 important warning sign that could impact your investment decision.
- See our latest analysis for Berkshire Hathaway. The report includes a comprehensive fundamental analysis summarized in a single visual, the Snowflake, making it easy to evaluate Berkshire Hathaway's overall financial health at a glance.
Looking for more Berkshire Hathaway style investment ideas?
If you like Berkshire Hathaway for its mix of resilience, cash flexibility and disciplined capital use, it can help to compare it with other opportunities that share some of those traits. The Simply Wall St Screener lets you quickly filter for businesses that fit your preferred mix of quality, balance sheet strength and risk level so you can build a watchlist that matches your own playbook.
- For investors who care most about capital staying intact through rough patches, start with companies that screen as relatively resilient and financially robust using the 31 resilient stocks with low risk scores.
- If you want to prioritise dependable fundamentals and solid balance sheets alongside Berkshire Hathaway, filter for businesses with strong finances and cleaner leverage profiles through the list of solid balance sheet and fundamentals (25 results).
- Readers looking to broaden beyond Berkshire Hathaway but still lean into quality can scan a curated set of lesser known yet fundamentally strong opportunities using the 19 high quality undiscovered gems.
Have feedback on this article? Concerned about the content? Get in touch with us directly. Alternatively, email editorial-team@simplywallst.com