


EN
St. Joe (JOE) Lifts Dividend After Strong Earnings But Is The Valuation Too Rich
St. Joe (JOE) just paired fresh third quarter 2026 earnings with a higher cash payout, lifting its fourth quarter dividend by 13% to $0.18 per share for investors.
At a share price of $69.97 on 7 November 2026, St. Joe has put in a 7.88% 1‑month share price return and a 16.99% year‑to‑date share price gain. Total shareholder return of 20.74% over one year and 47.86% over three years points to momentum that investors appear to be reassessing in light of the richer 32.6x P/E multiple and the dividend increase tied to the latest earnings release.
Scan how St. Joe compares to other income and real-asset plays that pair dividends with earnings power by checking out the hand picked 7 dividend fortresses in this space.
After a strong run, a richer 32.6x P/E and a higher dividend leave St. Joe looking less obvious on entry. Does the current price still offer enough upside for the risk?
Price-to-Earnings of 32.6x: Is it justified?
On Simply Wall St's numbers, St. Joe trades at a 3.3% discount to an estimated future cash flow value of $72.34, with the shares at $69.97 on 7 November 2026. At the same time, the stock changes hands on a P/E of 32.6x against a peer group around 23x. This signals that investors are paying a premium for each dollar of reported earnings.
The P/E ratio compares what the market is willing to pay today for one dollar of current net profit. For a real estate development and operating business like St. Joe, that means the market is anchoring heavily on earnings that can be influenced by land sales timing, hospitality cycles and commercial leasing performance.
Earnings have grown 10.3% per year over the past 5 years and 15.9% over the last year. This points to a solid profit track record yet still trails the Real Estate industry figure of 22% for the latest year. With return on equity at 15.6%, below the 20% level often associated with high efficiency, the valuation premium suggests investors are comfortable paying up relative to both the US Real Estate industry P/E of 13.8x and the 23x peer average.
That gap is wide, and it means the market is pricing St. Joe well ahead of sector norms on this metric alone, even though the firm is not classified as cheap on Simply Wall St's own preferred-multiple checks.
See what the numbers say about this price — find out in our valuation breakdown.
Result: Price-to-Earnings of 32.6x (OVERVALUED)
Still, St. Joe leans heavily on one market in Florida, so any hit to local housing demand or tourism could pressure earnings and challenge that premium valuation.
Find out about the key risks to this St. Joe narrative.
Another View On St. Joe's Value
The first impression is that St. Joe looks expensive on a 32.6x P/E. Yet Simply Wall St's DCF model points the other way, with the shares at $69.97 trading about 3.3% below an estimated future cash flow value of $72.34. That raises a simple question for investors: Which signal deserves more weight?
Look into how the SWS DCF model arrives at its fair value.
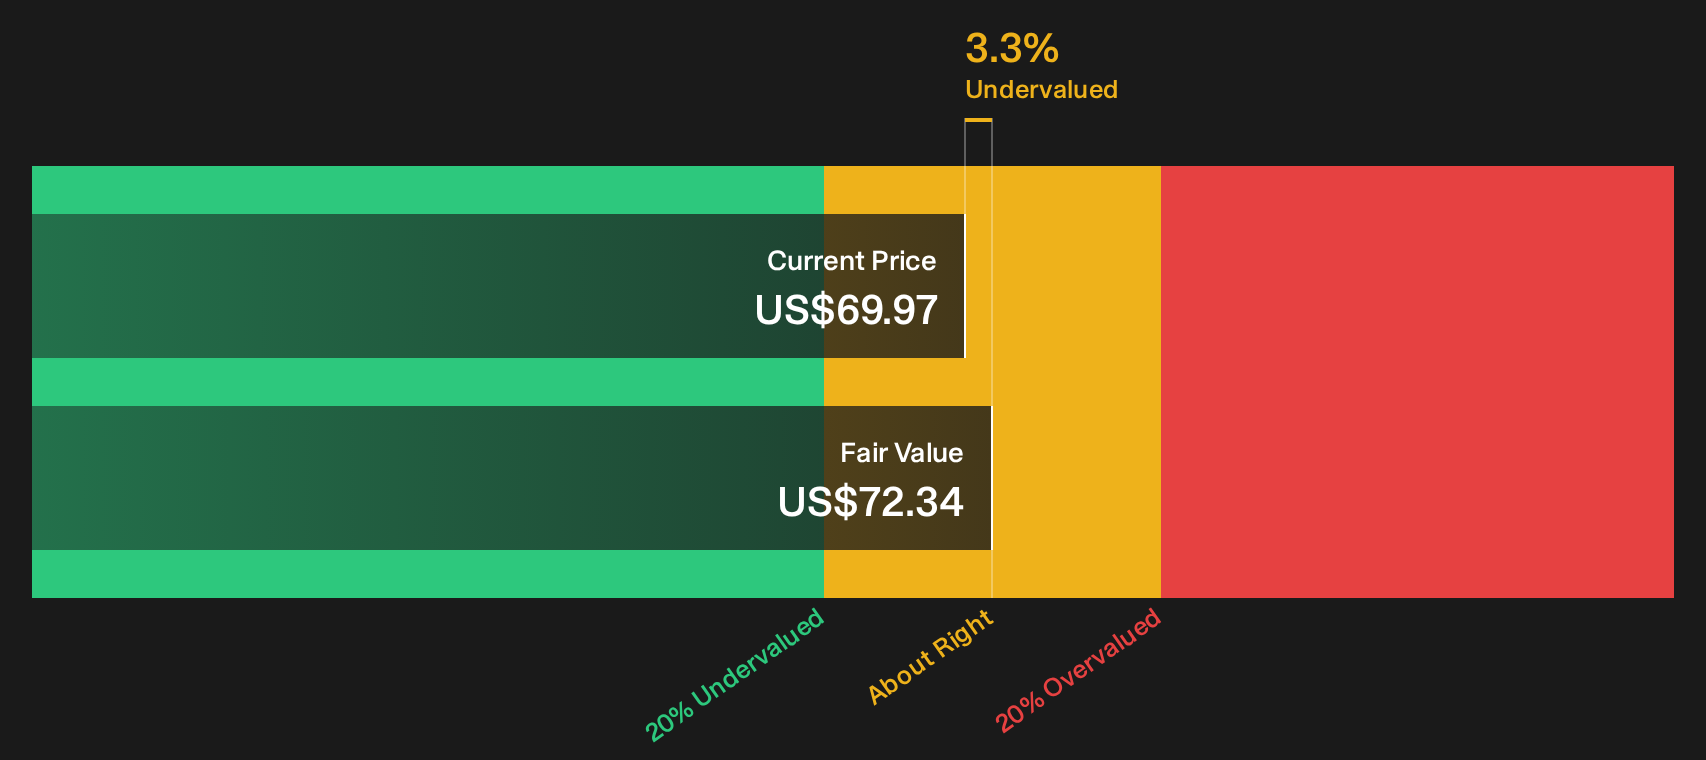
Simply Wall St performs a discounted cash flow (DCF) on every stock in the world every day (check out St. Joe for example). We show the entire calculation in full. You can track the result in your watchlist or portfolio and be alerted when this changes, or use our stock screener to discover 38 high quality undervalued stocks. If you save a screener we even alert you when new companies match - so you never miss a potential opportunity.
Next Steps
Mixed signals on St. Joe's value story can cut both ways, so use this window to review the data, weigh the upside and the downside, and see the 2 key rewards and 1 important warning sign
Looking for more investment ideas beyond St. Joe?
Use St. Joe as a reference point, then widen your options with focused screeners that surface different types of opportunities you might otherwise miss.
- Target potential mispricing by reviewing companies that combine strong fundamentals with attractive valuations through the 38 high quality undervalued stocks.
- Prioritise resilience by scanning businesses with robust finances and cleaner balance sheets using the list of solid balance sheet and fundamentals (25 results).
- Hunt for under the radar prospects by checking the 19 high quality undiscovered gems before others catch on.
Have feedback on this article? Concerned about the content? Get in touch with us directly. Alternatively, email editorial-team@simplywallst.com