


EN
Red Rock Resorts (RRR) Could Be 32% Undervalued As Earnings Slip And Dividend Holds
Red Rock Resorts (RRR) just paired a third quarter earnings update with a fresh quarterly dividend declaration, presenting both its income profile and recent profitability shift to investors at the same time.
Red Rock Resorts has seen its share price slide over the past quarter, with a 90 day share price return that declined 21.32% and a year to date share price return down 23.42%. However, the 3 year total shareholder return of 26.81% and 5 year total shareholder return of 20.25% point to stronger longer term outcomes, indicating that the latest earnings setback and dividend decision are being weighed more heavily in the near term than the broader history of returns.
Scan beyond Red Rock Resorts and compare this earnings and dividend setup with a curated 38 high quality undervalued stocks that also pair income with recently pressured share prices.
After a quarter that swung from profit to loss while the dividend kept flowing, Red Rock Resorts now sits at a crossroads. Does the current slide tilt the risk reward toward fresh buyers, or does it argue for lingering caution?
Most Popular Narrative: 32% Undervalued
Red Rock Resorts closed at $48.22 compared with a widely followed fair value estimate of $71.06, so the current setup hinges on whether future cash generation and project execution ultimately bridge that gap.
The development pipeline that includes the Durango North expansion with more than 275,000 square feet of additional casino and entertainment space and the fully financed North Fork tribal casino scheduled to open in early Q4 2026 offers new sources of incremental revenue and adjusted EBITDA.
See why 2 investors see Red Rock Resorts as 32% undervalued.
Result: Fair Value of $71.06 (UNDERVALUED)
Still, heavy capital expenditure with net debt around US$3.5b, alongside concentrated exposure to the Las Vegas locals market, could quickly pressure cash generation expectations for Red Rock Resorts.
Find out about the key risks to this Red Rock Resorts narrative.
Another View: What Red Rock Resorts’ P/E Is Really Saying
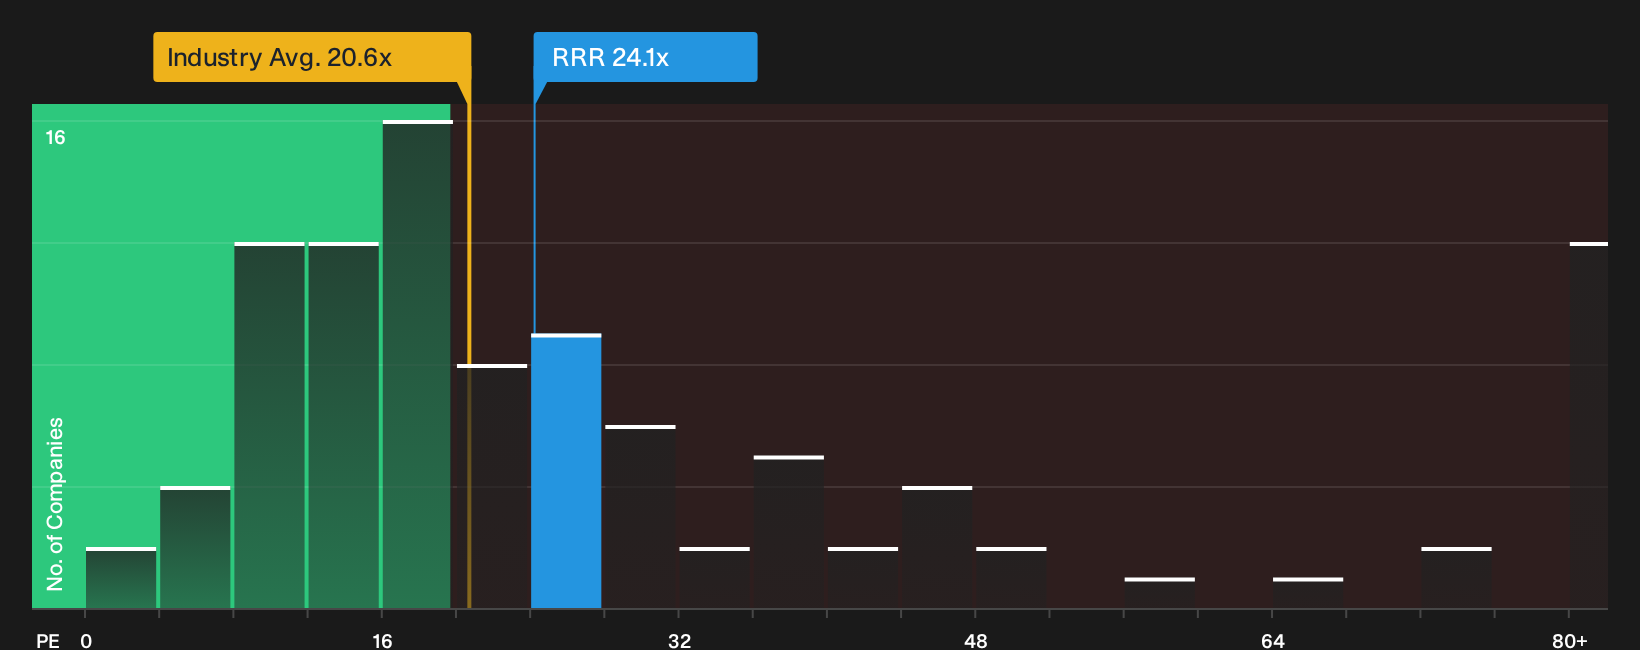
That 32% gap to fair value tells only one story. On earnings multiples, Red Rock Resorts trades on a P/E of 24.1x, which looks expensive compared with the US Hospitality sector at 20.6x, yet sits well below its peer average of 51.5x and an estimated fair ratio of 31.3x. For investors, that mix points to both valuation risk if sector sentiment weakens and potential upside if the market leans toward the higher peer or fair ratio. Which side feels more realistic to you today?
To pressure test those earnings-based signals against detailed fundamentals, take a closer look at how this pricing stacks up in our structured valuation workup. Then decide which story you trust more, the market’s current multiple or where the fair ratio suggests it could drift over time, with the help of See what the numbers say about this price — find out in our valuation breakdown..
For a cleaner view of how Red Rock Resorts compares against its industry on headline valuation metrics, use the following visual as a reference point before weighing any next steps,
Next Steps
Sentiment on Red Rock Resorts is split, with clear risk flags but also real bright spots that investors keep circling back to, so do not wait to run your own numbers and pressure test the story from both sides using our 3 key rewards and 4 important warning signs.
Looking for more investment ideas beyond Red Rock Resorts?
If Red Rock Resorts has you thinking harder about risk, reward, and timing, then now is the moment to widen your watchlist and compare fresh opportunities.
- Target resilient balance sheets by reviewing a list of solid balance sheet and fundamentals (25 results) that highlights businesses with financial strength front and center.
- Hunt for underappreciated value by scanning a 19 high quality undiscovered gems that spotlights quality companies many investors may be overlooking.
- Reduce portfolio gut checks by filtering for a 31 resilient stocks with low risk scores that focuses on stocks with more measured risk profiles.
Have feedback on this article? Concerned about the content? Get in touch with us directly. Alternatively, email editorial-team@simplywallst.com