


EN
LONG-TERM CYCLES AND PRICE PROJECTIONS IN PRECIOUS METALS
Precious metals like gold and silver sit directly at the very heart of the global real economy and the financial world. Gold, which has never surrendered its crown as the pinnacle of global asset value, along with silver, a permanent fixture among the world's top 10 assets, have both mounted a rapid advance in the post-COVID-19 era. In truth, the fundamental analysis of gold and silver possesses a historical depth and contemporary influence that could not be crammed into hundreds of books. Today, however, our focus will be strictly on price movements. Leaving all fundamental analysis factors aside, let us concentrate solely on long-term price analysis.
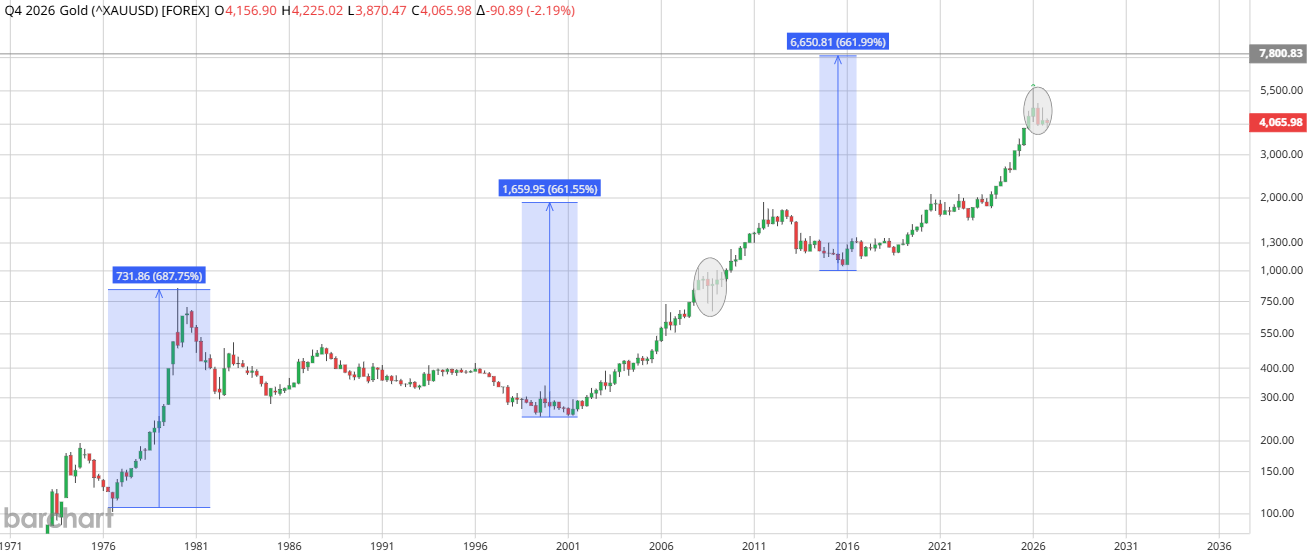
Long-Term Gold Cycles
- The 1976–1980 Period: Gold completed this brief 4-year cycle with a massive 600% surge.
- The 1980–2000 Period: The ensuing downtrend lasted a staggering 20 years, wiping out 400% of gold's value.
- The 2000–2011 Period: The uptrend spanned 11 years, registering a 600% advance.
- The 2011–2015 Period: The corrective decline lasted 4 years, with gold losing 50% of its value.
- The 2015–2026 Period: The current uptrend is in its 9th year and has captured a 400% gain so far.
Looking purely at the chart and historical prices, one could deduce that gold still has a 230% upside potential ahead. This thesis is heavily supported by the striking similarity between the sharp market correction of 2008—which occurred during the 2000–2011 macro uptrend—and the recent price actions seen in 2026. Due to this historical cyclical fractal, long-term investors anticipating $7,800 per ounce in the coming years may well be proven right.
Another critical takeaway from the chart is that upside cycles are becoming progressively shorter. This indicates growing investor participation in the financial architecture of gold. Moving forward, we can project that the duration of both bullish and bearish cycles will contract even further. While the exhausting length of historical cycles used to deter market participants, these shorter horizons could invite a broader wave of long-term investors into the market.
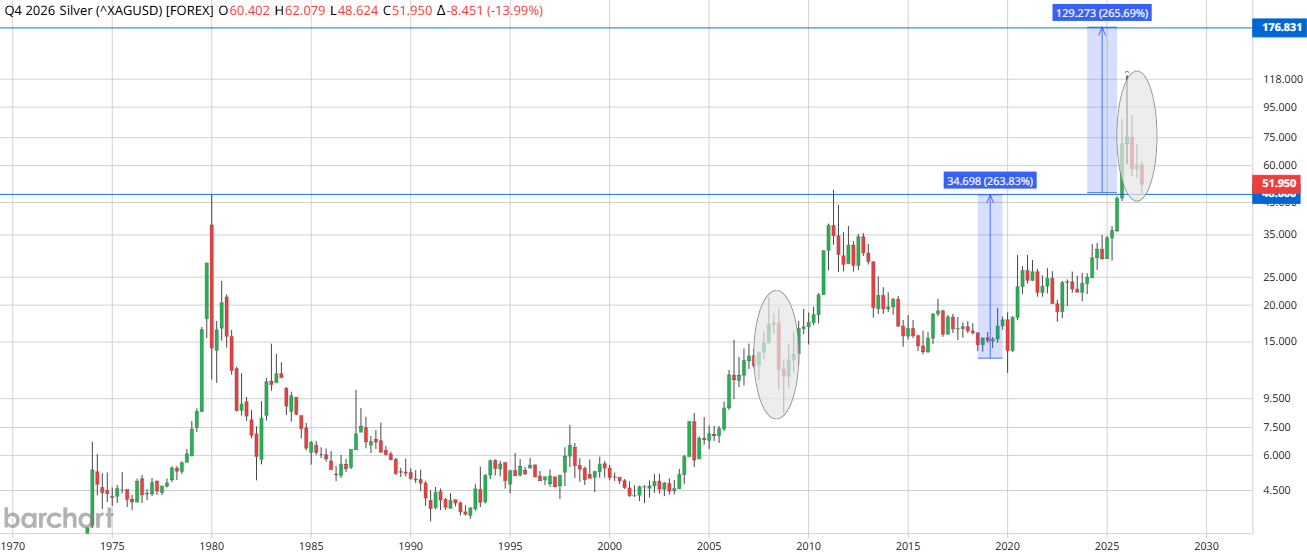
Long-Term Silver Cycles
- The 1971–1980 Period: During this roughly 9-year bull run, silver skyrocketed from $1.5 to $49.5, yielding an approximate 3,200% return.
- The 1980–1993 Period: The bear market dragged on for about 13 years. Silver collapsed from $49.5 down to $3.5, enduring a 93% devaluation.
- The 1993–2011 Period: The recovery and subsequent bull market lasted 18 years, driving silver from $3.5 back to its former peak of $49.5, an advance of roughly 1,315%.
- The 2011–2020 Period: The bear cycle persisted for 9 years, with silver sliding from $49.5 to $11.6, a 77% drop.
- The 2020–2026 Period: The expansion cycle played out over approximately 6 years. Silver rallied from $11.6 to around $120; however, the recent market pullback has erased a portion of these gains.
Assuming silver maintains its primary secular uptrend of over 1,000%, a long-term technical target of $177 remains a highly plausible chart scenario.
The macro chart demonstrates that silver's expansionary and contractionary cycles are shifting over time. Most notably, the velocity of the latest rally was exceptionally swift compared to historical multi-decade bull runs. Just like gold, another striking correlation is the resemblance between the severe liquidations of the 2008 financial crisis and the price action observed in 2026. From a purely technical standpoint, the $177 level serves as a valid long-term roadmap anchored to historical precedents.
Naturally, silver remains a far more aggressive asset than gold. Given its high volatility, adopting a rational approach to risk management dictates allocating a smaller percentage of a portfolio to silver relative to gold.
Historical Growth Rates and the 2040 Projection
Gold's journey from roughly $100 in 1976 to $4,500 by 2026 represents a 40-fold increase (a 4,400% net advance), translating into a Compound Annual Growth Rate (CAGR) of 7.91%. If we extrapolate this historical compound growth rate alongside silver’s 6.98% CAGR (measured from its 1971 cyclical floor of $1.27 to today’s $52 benchmark) out to the year 2040, we arrive at the following theoretical reference model:
| Year | Gold Ounce (USD) | Silver Ounce (USD) |
|---|---|---|
2026 |
4,500 | 52.00 |
2027 |
4,856 | 55.63 |
2028 |
5,240 | 59.51 |
2029 |
5.655 | 63.67 |
2030 |
6,102 | 68.11 |
2031 |
6,585 | 72.87 |
2032 |
7,106 | 77.95 |
2033 |
7,668 | 83.39 |
2034 |
8,274 | 89.21 |
2035 |
8,929 | 95.44 |
2036 |
9,635 | 102.10 |
2037 |
10,397 | 109.23 |
2038 |
11,220 | 116.85 |
2039 |
12,107 | 125.01 |
2040 |
13,065 | 133.74 |
How Should We Interpret These Figures?
Does this mean we should map our investment strategies entirely to these specific mathematical targets? Absolutely not. This matrix simply represents the mathematical projection of multi-decade historical averages into the future. Spot prices have routinely decoupled from linear timelines in the past, and they will continue to do so. Nonetheless, these figures establish a highly valuable point of reference.
- Differentiating "Cheap" vs. "Expensive": In the coming years, if spot market prices linger significantly below these mathematical projections, it allows us to define that asset as fundamentally "underpriced." For instance, if the historical compounding model dictates a target of $6,102 by 2030, but gold is trading in the open market at $3,500, we can conclude that gold is severely lagging behind its historical multi-decade trend line. Conversely, if prices spike to $8,000, it may be deemed "overextended" for that specific window. Thus, this framework provides a historical baseline to anchor our expectations.
- A Theoretical Model Acknowledgment: Both the chart analysis and the compound growth rates outlined here are purely theoretical simulations. They must be viewed strictly as mathematical reflections of past performance. In the real world, the actual pricing mechanism and ultimate trajectory of gold and silver are governed by hundreds of complex macroeconomic, geopolitical, and systemic financial variables.
Thank you for reading.