


EN
Apollo Global Management (APO) Launches European Credit Company, Is The Stock Still Cheap?
Apollo Global Management (APO) has landed on investor radars after a busy week that combined fresh buyback data, third quarter earnings, a new European credit platform launch, and a reaffirmed quarterly dividend.
At a share price of US$116.75, Apollo Global Management has seen its 90 day share price return fall 11.57% and its year to date share price return decline 20.37%. However, the 5 year total shareholder return of 71.51% and 3 year total shareholder return of 43.92% point to a stronger longer run record, suggesting recent buybacks, dividend affirmations and the launch of European Credit Company are being weighed against the sharper near term earnings volatility.
Spot under pressure plays like Apollo Global Management and compare them with a curated 38 high quality undervalued stocks that couples earnings quality with balance sheet strength.Bulls point to Apollo Global Management’s long run returns, buybacks and new European credit platform. Bears focus on the recent loss and share price slide. Which story fits the valuation numbers that follow?
Preferred Price-to-Sales of 2.3x: Is it justified?
Apollo Global Management trades on a P/S of 2.3x, while our DCF model points to a future cash flow value above the recent $116.75 share price. The market is assigning a richer sales multiple than both peers and an estimated fair level.
The price to sales ratio compares the value the market places on a stock to the revenue the business generates. For a diversified financial group like Apollo Global Management that runs asset management, principal investing, and retirement services, investors often lean on P/S when near term earnings are uneven or loss making, as is the case today.
Here, the 2.3x P/S is described as expensive versus both the US Diversified Financial industry average of 2.2x and a peer group average of 1.1x. It is also well above an estimated fair P/S of 1x, which signals a strong premium that the market could eventually reassess if the narrative around revenue scale, profitability and risk shifts.
Explore the SWS fair ratio for Apollo Global Management.
Result: Price-to-Sales of 2.3x (OVERVALUED)
Still, revenue falling 59.81% alongside a reported net loss of US$851 million leaves Apollo Global Management exposed if earnings remain uneven or if fundraising appetite cools.
Find out about the key risks to this Apollo Global Management narrative.
Another View: SWS DCF Says Apollo Looks Cheap
The first lens paints Apollo Global Management as expensive on 2.3x P/S, but the SWS DCF model pulls in the opposite direction. At a share price of $116.75 and an estimated future cash flow value of $160.95, that framework points to Apollo trading at roughly a 27% discount.
This gap between a premium sales multiple and a discounted cash flow estimate raises a simple question for investors. Is the market overpaying for near term revenue while underpricing the longer term cash generation story?
Look into how the SWS DCF model arrives at its fair value.
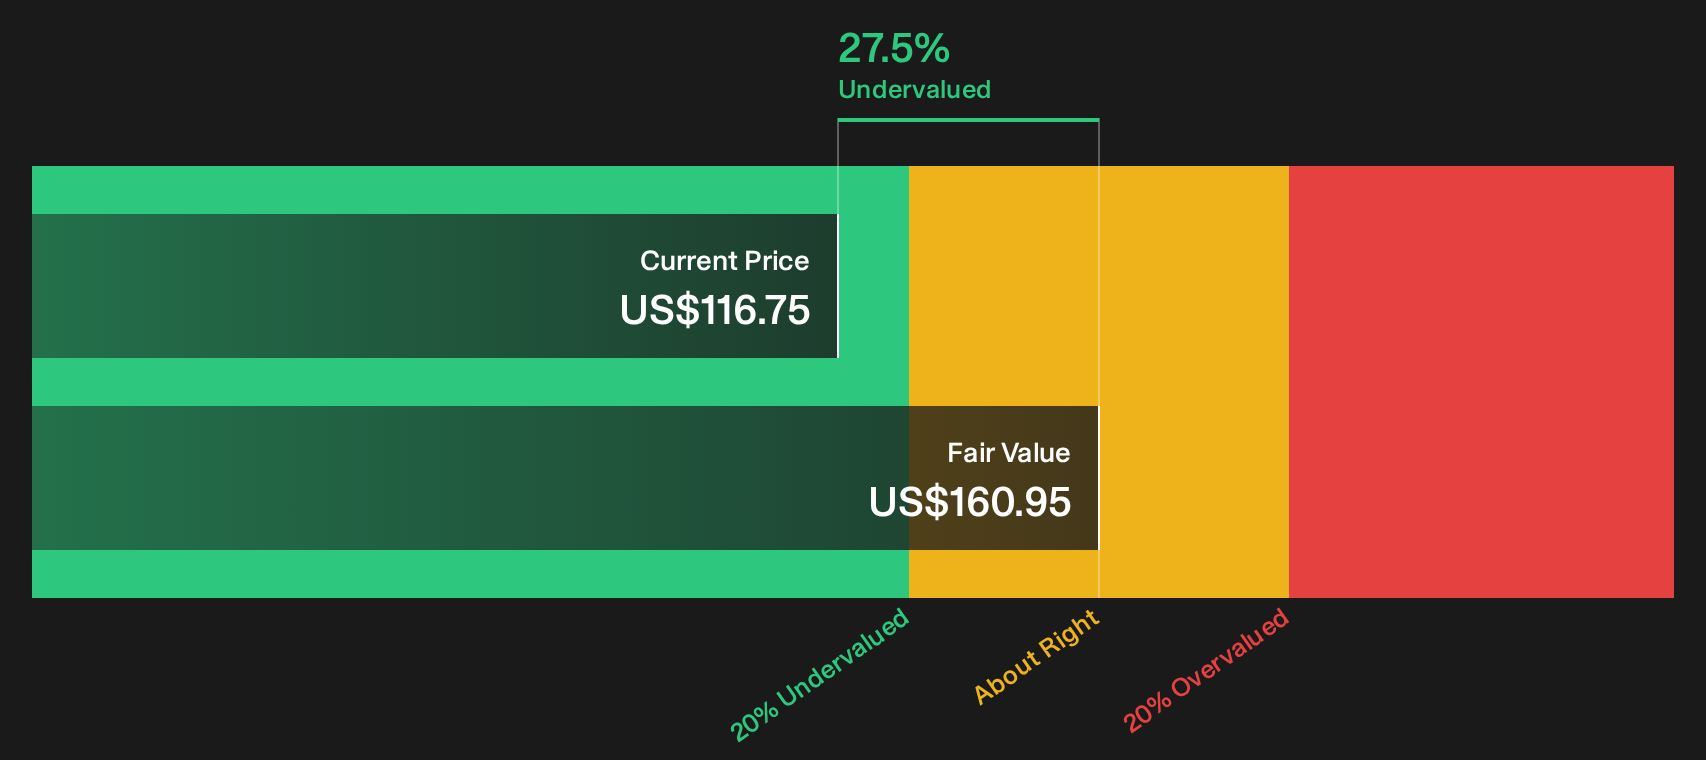
Simply Wall St performs a discounted cash flow (DCF) on every stock in the world every day (check out Apollo Global Management for example). We show the entire calculation in full. You can track the result in your watchlist or portfolio and be alerted when this changes, or use our stock screener to discover 38 high quality undervalued stocks. If you save a screener we even alert you when new companies match - so you never miss a potential opportunity.
Next Steps
Mixed messages or a clear signal, only you can decide how the recent moves at Apollo Global Management stack up. Act while the numbers and narrative are fresh in your mind, then round out your view with the 3 key rewards and 2 important warning signs
Looking for more investment ideas beyond Apollo Global Management?
If Apollo Global Management has sharpened your focus on pricing and risk, do not stop here. Broaden your watchlist now with screened ideas built around quality, resilience, and income.
- Target potential mispricings by reviewing a curated set of value focused stocks through the 38 high quality undervalued stocks.
- Lock in on balance sheet strength by scanning companies filtered through the list of solid balance sheet and fundamentals (25 results).
- Spot early stage opportunities with quality metrics on your side using the 19 high quality undiscovered gems.
Have feedback on this article? Concerned about the content? Get in touch with us directly. Alternatively, email editorial-team@simplywallst.com