


EN
Pershing Square (PS) Launches A New Vehicle Following Earnings Loss As Valuation Stays In Focus
Pershing Square (PS) has landed in focus after its latest quarterly update, which combined a third quarter earnings report with fresh plans for a new publicly listed investment vehicle.
The share price reaction has been sharp in both directions recently, with a 12.68% 7 day share price return and a 30 day share price return that fell 12.28%. However, the year to date share price return of 112.6% and 90 day gain of 35.82% suggest Pershing Square’s momentum has been building as investors weigh the new vehicle plans against the latest earnings loss.
Scan how Pershing Square compares with other alternative asset managers showing sharp price moves and rising attention by screening for 19 high quality undiscovered gems in this corner of the market.
Pershing Square has doubled this year, even as the latest quarter swung to a loss and a new listed vehicle enters the story. Do you lean into the rerating now, or hold out for a cleaner entry point once valuation is clearer?
Most Popular Narrative: 2.9% Undervalued
Pershing Square last closed at $51.45, a touch below the most followed fair value estimate of $53. This frames the current debate around upside versus execution risk.
The launch of Pershing Square Ventures as a permanent capital crossover vehicle targeting high growth private and pre IPO companies gives the firm access to earlier stage technology and AI driven businesses that public investors often cannot reach directly. This can diversify fee streams and support growth in total assets under management.
See why 0 investors see Pershing Square as 3% undervalued.
Result: Fair Value of $53 (UNDERVALUED)
Still, the bullish Pershing Square story depends heavily on a concentrated tech driven portfolio and on expansion plans that could disappoint if investor appetite or deal flow weakens.
Find out about the key risks to this Pershing Square narrative.
Another View on Pershing Square’s Valuation
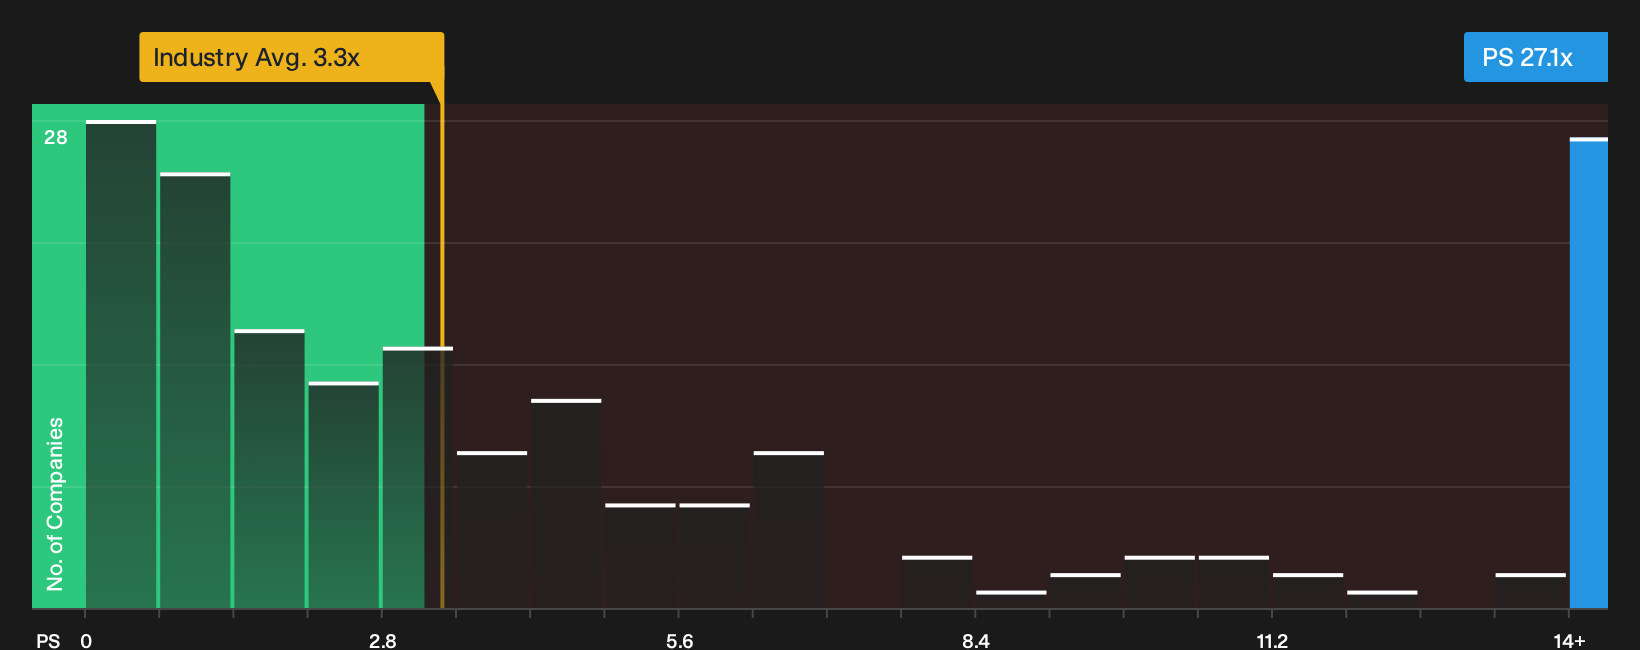
The fair value narrative pegs Pershing Square at $53, yet the market is paying a very different price for its current fundamentals. On a P/S of 27.1x, the stock trades far above the US Capital Markets industry at 3.4x and peers at 2.2x, while the fair ratio sits at just 1.3x. That kind of gap can amplify both upside and downside if expectations reset. Which side of that trade are you really underwriting?
Before leaning on this pricing yardstick alone, it helps to see how the broader valuation stack lines up across similar businesses and where Pershing Square fits into that picture in the See what the numbers say about this price — find out in our valuation breakdown..
Visual context also matters when you are weighing whether this premium is justified relative to the sector, which is where the
Next Steps
Curious whether Pershing Square’s sharp rerating really matches the mix of promise and pressure outlined here? Move fast and weigh both sides by checking the 2 key rewards and 1 important warning sign.
Looking for more investment ideas beyond Pershing Square?
If Pershing Square has your attention, do not stop here. Broaden your watchlist, pressure test your convictions and keep fresh candidates on your radar before the market moves first.
- Zero in on potential mispricings by scanning companies screened as 39 high quality undervalued stocks that match strong fundamentals with more modest expectations.
- Strengthen your defense by reviewing a list of solid balance sheet and fundamentals (24 results) so you can focus on businesses with sturdier financial footing.
- Spot quieter opportunities by tracking a 29 resilient stocks with low risk scores where volatility scores are lower and fundamentals do more of the talking.
Have feedback on this article? Concerned about the content? Get in touch with us directly. Alternatively, email editorial-team@simplywallst.com