


EN
Del Monte (DMC) Could Be 45% Undervalued After Q3 Profit And Dividend Update
Del Monte earnings and dividend move into focus
Del Monte (DMC) drew fresh attention after third quarter results showed sales of US$1,095.3 million and net income of US$18.3 million, alongside a declared quarterly cash dividend of US$0.30 per share.
At a share price of US$27.39, Del Monte has had a tough year on the market, with the share price return down 22.45% year to date and the 1 year total shareholder return declining 24.00%. This contrasts with the 3 year total shareholder return of 29.25%, which points to a much stronger earlier phase that current sentiment has faded from.
Scan beyond Del Monte and compare this earnings and dividend story with a curated 39 high quality undervalued stocks that currently show stronger price momentum or more resilient market sentiment.
Del Monte now pairs a softer share price with a steady dividend and a swing back to quarterly profit. Does that balance of setback and progress still reward buyers at this valuation level?
Preferred P/E of 15.9x for Del Monte: Is it justified?
On valuation, Del Monte trades on a P/E of 15.9x, which points to a stock that screens as cheaper than many peers despite the softer share price performance this year.
The P/E ratio compares what investors pay for each dollar of earnings and it matters a lot for a mature food and beverage group where growth tends to be steady rather than rapid. For Del Monte, a 15.9x P/E suggests the market is not assigning a premium for its earnings profile, even though earnings growth over the past year of 1.6% contrasts with the Food industry figure of a 4.6% decline.
Relative pricing adds more context. The current P/E of 15.9x sits below the US Food industry average of 18.5x and well under the peer average multiple of 53.6x. This signals a much more conservative valuation on Del Monte compared with similar businesses.
Explore the SWS fair ratio for Del Monte.
Result: Price-to-Earnings of 15.9x (UNDERVALUED)
Still, the picture for Del Monte can shift quickly if fresh produce pricing weakens or if higher logistics and freight costs begin to squeeze margins.
Find out about the key risks to this Del Monte narrative.
Another view on Del Monte value using cash flows
The earnings multiple paints Del Monte as modestly cheap. A different lens tells a stronger story. Simply Wall St's DCF model suggests the shares trade around 45.1% below an estimated future cash flow value of about US$49.93 per share. That is a wide gap. Does it flag mispricing, or simply higher risk around those long term assumptions?
Look into how the SWS DCF model arrives at its fair value.
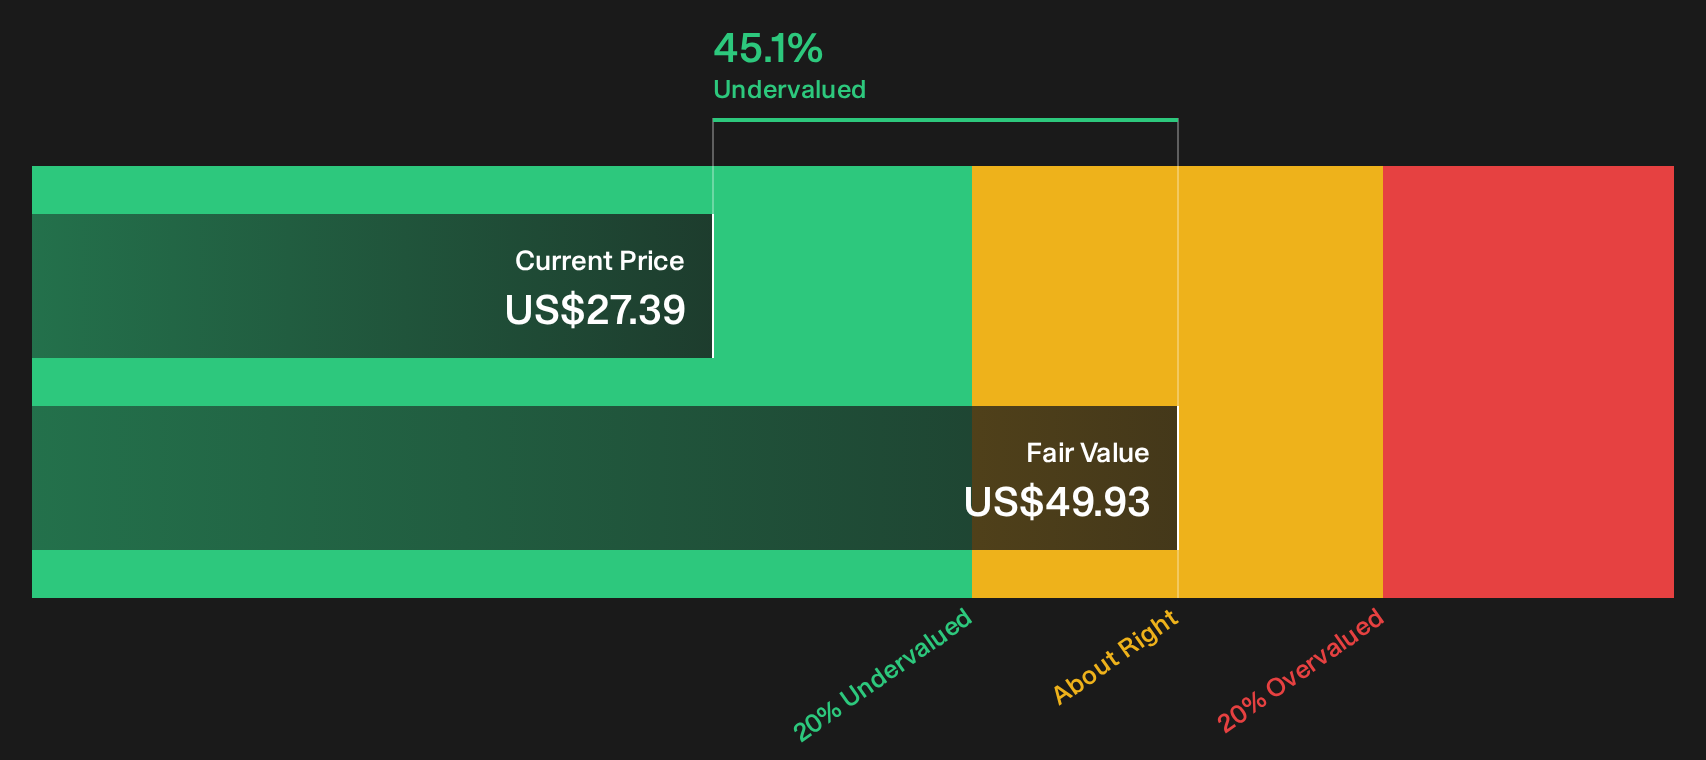
Simply Wall St performs a discounted cash flow (DCF) on every stock in the world every day (check out Del Monte for example). We show the entire calculation in full. You can track the result in your watchlist or portfolio and be alerted when this changes, or use our stock screener to discover 39 high quality undervalued stocks. If you save a screener we even alert you when new companies match - so you never miss a potential opportunity.
Next Steps
Mixed signals around Del Monte can be confusing, so move quickly from headline impressions to your own checklist of facts by weighing both the upside and the caution flags with the 4 key rewards and 2 important warning signs.
Looking for more Del Monte sized investment ideas?
Do not stop your research with Del Monte alone. Use the Simply Wall St screener to quickly scan fresh opportunities that fit the risk and return profile you actually want.
- Target cash rich opportunities where dividends do more of the heavy lifting for your returns by reviewing our 8 dividend fortresses.
- Focus on stability by filtering for companies with stronger finances and durable earnings using the list of solid balance sheet and fundamentals (24 results).
- Search for tomorrow's potential leaders before the crowd pays attention with a focused pass through the 19 high quality undiscovered gems.
Have feedback on this article? Concerned about the content? Get in touch with us directly. Alternatively, email editorial-team@simplywallst.com