


EN
Ryerson Holding (RYZ) Could Be 80% Below Fair Value After Earnings And Guidance
Ryerson Holding (RYZ) just packed several key updates into one day, pairing a fresh quarterly dividend declaration with detailed fourth quarter earnings guidance and a new snapshot of recent buyback activity.
Ryerson Holding shares now trade at US$27.60, with a 1-day share price return of 3.84% that arrived after the strong third quarter earnings release, updated fourth quarter guidance and fresh capital returns. However, the year-to-date share price return of 7.14% and 1-year total shareholder return of 38.64% suggest longer term momentum has been steadier than the recent 7-day share price pullback of 11.40% implies.
Scan how Ryerson Holding fits within the broader metals and materials story by comparing it with a hand picked list of solid balance sheet and fundamentals (24 results)
The mixed short term share move sets up a simple tension for Ryerson Holding investors. After this earnings and guidance reset, does the current price still leave enough upside to compensate for the risks in the metals cycle?
Preferred P/E of 101.2x: Is it justified?
Ryerson Holding screens very expensive on earnings at a P/E ratio of 101.2x against a last close of $27.60, which puts the stock at a rich premium to both its own recent profit profile and sector yardsticks.
The P/E multiple compares Ryerson Holding's share price with its earnings per share and is often used as a quick gauge of how much investors are paying for current profitability. For an industrial metals distributor, that lens lets you see how the market is pricing a highly cyclical earnings stream where profits can swing with steel and aluminum demand.
Here, the market is attaching a much heavier price tag to each dollar of Ryerson Holding earnings than to peers, which suggests investors are either comfortable with recent earnings volatility or are giving management credit for the turnaround from losses to profitability. Any reversal in that profit picture or change in sentiment around metals demand could matter more when the starting valuation is this stretched.
The contrast is sharp when set against benchmarks. Ryerson Holding trades on a P/E of 101.2x while the peer group average sits at 19.9x and the broader US Metals and Mining industry sits at 15.5x, which signals a very strong premium that leaves less room for disappointment if earnings or cash generation soften.
Result: Price-to-Earnings of 101.2x (OVERVALUED)
See what the numbers say about this price — find out in our valuation breakdown.
Still, a P/E this full can quickly look fragile if metals demand softens or if Ryerson Holding encounters pressure on its thin net income base.
Find out about the key risks to this Ryerson Holding narrative.
Another view on Ryerson Holding’s value
A second lens tells a very different story. Our DCF model estimates Ryerson Holding’s future cash flows at about $141.58 per share while the market price is $27.60. That points to a big implied discount. The real question is whether those long range assumptions hold up through the next metals cycle.
Look into how the SWS DCF model arrives at its fair value.
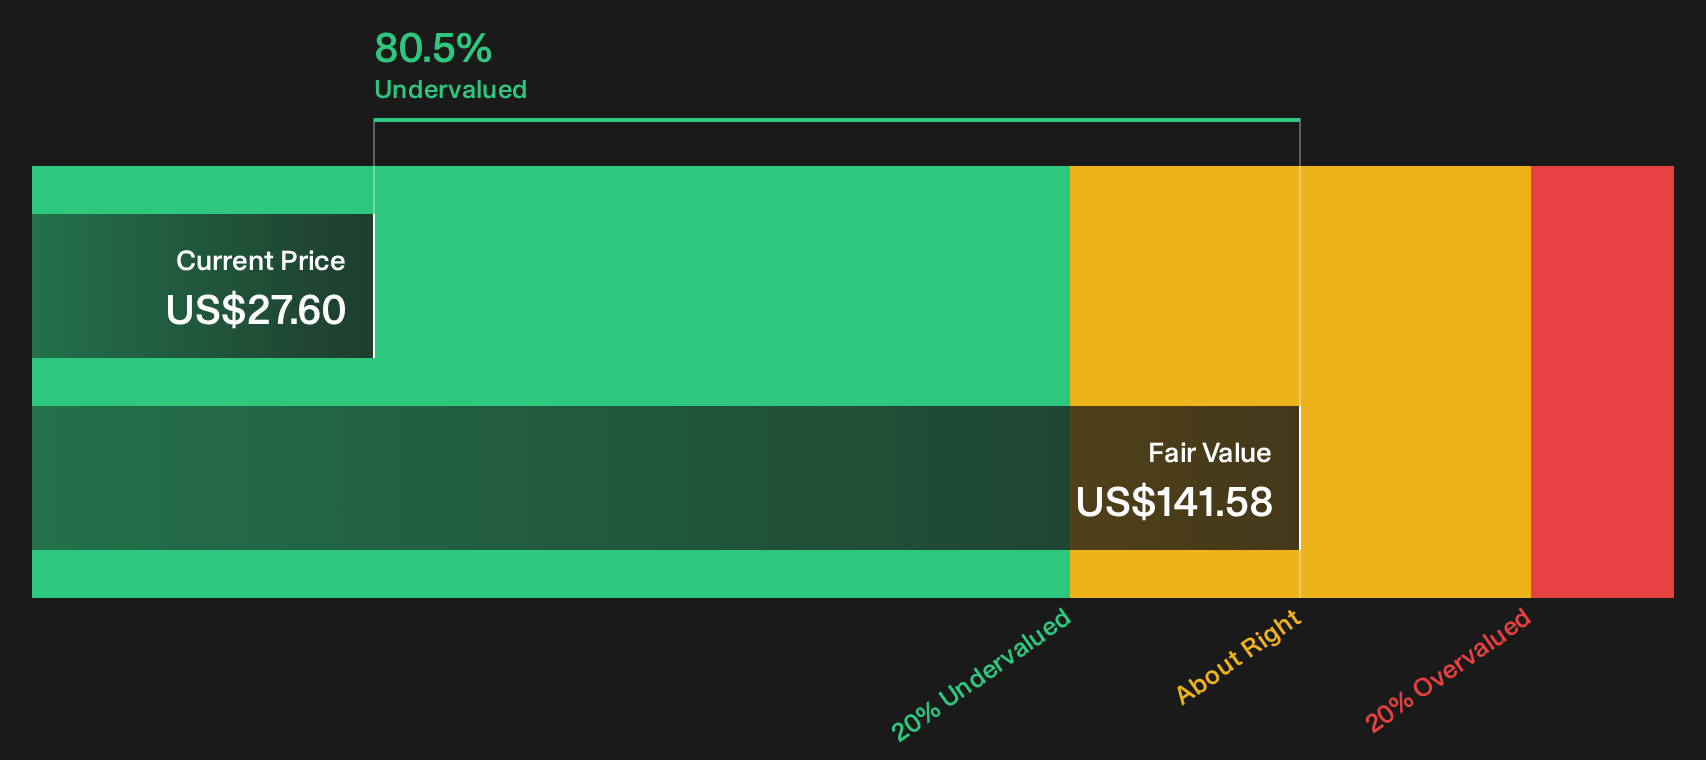
Simply Wall St performs a discounted cash flow (DCF) on every stock in the world every day (check out Ryerson Holding for example). We show the entire calculation in full. You can track the result in your watchlist or portfolio and be alerted when this changes, or use our stock screener to discover 39 high quality undervalued stocks. If you save a screener we even alert you when new companies match - so you never miss a potential opportunity.
Next Steps
Curious whether Ryerson Holding’s rich valuation and discounted cash flow story line up with your own risk appetite? Act quickly, examine the underlying drivers, and then weigh the balance of 2 key rewards and 4 important warning signs.
Looking for more ideas beyond Ryerson Holding?
If Ryerson Holding feels fully priced or just one piece of your playbook, broaden your opportunity set with a few focused idea lists that match different risk profiles.
- Target potential upside by scanning companies trading on compelling valuations through a curated set of 39 high quality undervalued stocks that combine quality fundamentals with attractive pricing.
- Grow your income stream by zeroing in on consistent payers from a selection of 8 dividend fortresses that prioritize strong yields backed by underlying cash flow.
- Dial back portfolio stress by concentrating on financially robust businesses using a focused 29 resilient stocks with low risk scores that emphasizes durability over drama.
Have feedback on this article? Concerned about the content? Get in touch with us directly. Alternatively, email editorial-team@simplywallst.com