


EN
SEGRO (LSE:SGRO) Looks Fairly Valued As Rule 8.3 Filings Draw Fresh Interest
Institutional interest in SEGRO after Rule 8.3 disclosures
SEGRO (LSE:SGRO) has drawn fresh attention after several institutions, including Millennium International Management, Natixis and TIAA/Nuveen, filed Rule 8.3 disclosures detailing sizeable positions and derivatives tied to the warehouse focused REIT.
Recent Rule 8.3 disclosures have landed while SEGRO’s share price sits at £9.134, with a strong year to date share price return of 28.18% and a 1 year total shareholder return of 32.10%, pointing to building momentum despite a softer 90 day share price move that is down 4.81%.
Scan how other warehousing and infrastructure focused real estate stocks are reacting to similar institutional flows with our hand picked list of solid balance sheet and fundamentals (9 results).
Bulls point to SEGRO’s £22.0b portfolio and recent double digit revenue and net income growth. Bears focus on the recent 90 day share price decline. Which story does the current valuation actually support?
Most Popular Narrative: 3% Undervalued
SEGRO last closed at £9.13, while the most followed narrative assigns a fair value of £9.39, which points to a small discount and keeps the spotlight on how its physical assets connect to fast growing digital demand.
The physical world is increasingly struggling to bear the exponential weight of the digital world. In our previous analyses, we argued that UK-based Segro (SGRO.LN), with its 190 MVA (Mega Volt Ampere) grid reserve and 1.2 GW of data center development capacity, would transform from a traditional warehouse lessor ("Powered Shell" model) into a fully fitted energy and data infrastructure player.
See why 14 investors see SEGRO as 3% undervalued.
The narrative, according to Composite_Research, leans heavily on SEGRO's role in warehousing, industrial property and data centres across the UK and Continental Europe. It links that footprint to a 22.0b portfolio, a 10.4% annual revenue growth rate and a 28.48% expected yearly increase in earnings that analysts forecast over the next three years.
Supporters of this view often highlight that SEGRO's earnings are forecast to grow faster than the wider UK market, where profit growth is expected at 10.3% per year. They also point to projections that SEGRO's top line could expand faster than the broader UK market, with revenue growth estimates at 10.4% per year versus 3.3% for the market, even though that revenue pace is still below the 20% threshold sometimes associated with high growth stories.
Alongside that growth framing sits a set of risk flags. Reported earnings over the last five years declined 31.9% per year. The latest 12 month period to 30 June 2026 included a one off loss of £224.0m, which the statements flag as a distortion to the headline profit picture. Net profit margins are 40%, down from 88.8% a year earlier, and return on equity is described as low at 2.5%, with forecasts suggesting only 4.2% ROE in three years.
Balance sheet quality is another tension point. SEGRO is flagged as being in a weaker financial position because debt is not well covered by operating cash flow and 100% of liabilities are funded from higher risk sources like external borrowing rather than customer deposits. That matters for a REIT with a £12.4b market cap that still needs capital to grow, even if management has historically talked about disciplined capital allocation.
On the income side, the narrative stresses SEGRO as a regular payer. The stock is marked as offering a reliable 3.4% dividend yield, which may appeal to investors who want income from real estate linked assets. At the same time, the valuation framework behind the narrative states SEGRO is expensive on traditional earnings based measures.
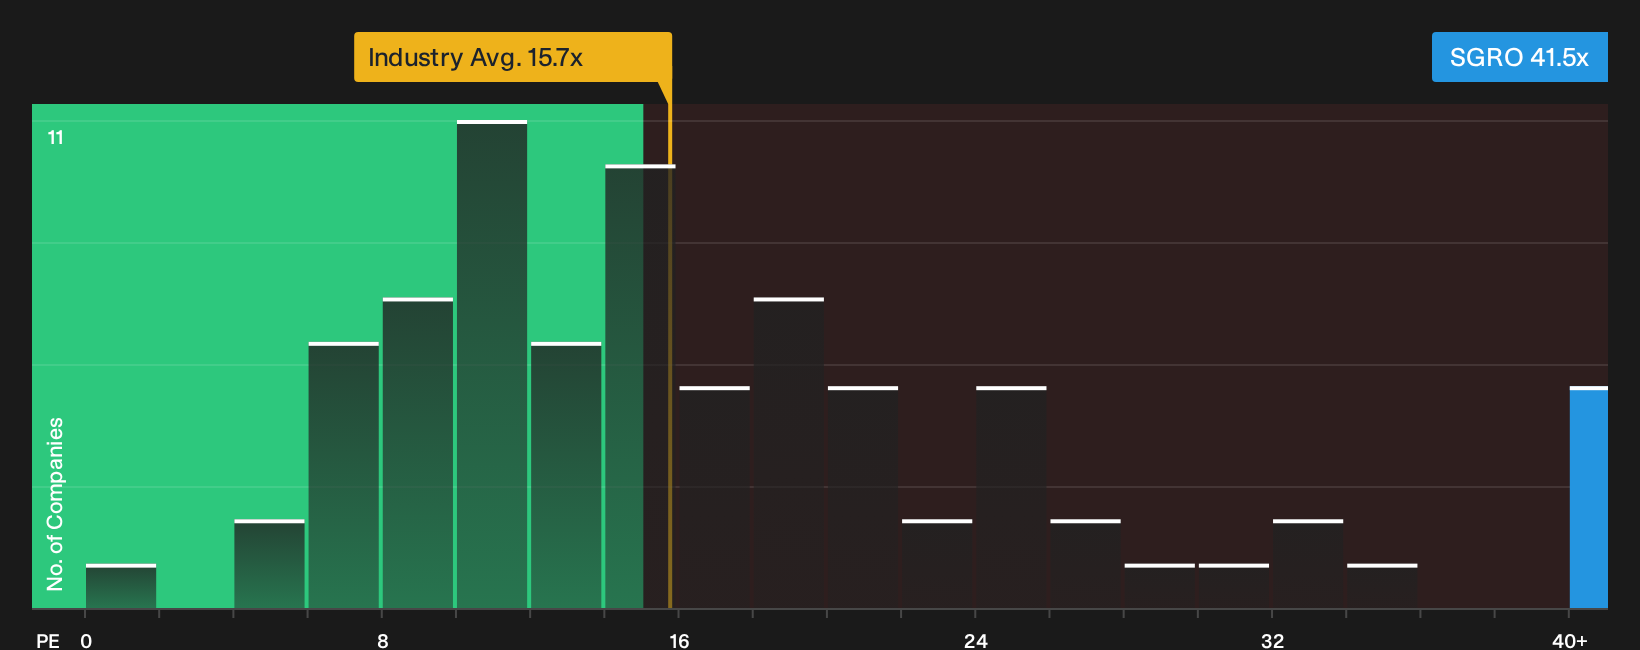
The P/E multiple of 41.5x is described as high compared with a fair P/E estimate of 18.5x. It is also flagged as richer than both the global Industrial REITs average of 15.7x and a 14.2x peer group average. That gap suggests the market is already pricing in a premium for SEGRO relative to comparable industrial REITs, even before considering any additional uplift implied by narrative driven fair value work.
DCF style analysis inside the statements points in the same direction. The SWS DCF model places the future cash flow value at £4.23 per share, while SEGRO trades at £9.13. On that framework, the stock is described as trading above the estimate of future cash flow value, which reinforces the idea that traditional valuation cross checks are less generous than the narrative's £9.39 fair value reading.
Short term performance metrics have still looked strong into November 2026, with a 1 year total shareholder return of 32.10% and a 3 year total return of 32.86%. Those outcomes outpaced both the UK market return of 10.7% over the past year and the 6.6% return from the UK Industrial REITs group over the same period, which helps explain why a premium valuation has held even as earnings based indicators point to weaker profitability and lower quality reported profit.
Governance checks provide another layer. SEGRO's board is described as 80% independent, with an average director tenure of 5.5 years, and management tenure of 3.3 years is tagged as experienced. CEO David John's total compensation of US$2.88m is flagged as below the average for UK companies of similar size, even though his pay has risen more than 20% in a year when earnings fell more than 20%. For some investors, that mix of lower absolute pay and a rapid year on year increase against weaker earnings may warrant closer reading of the detailed remuneration report.
Income focused investors may pay attention to the combination of a reliable 3.4% dividend and forecasts for significant earnings growth. The statements note that earnings are expected to expand by 28.5% per year and that this growth pace is projected to be higher than the UK market. If those forecasts play out, they would help support future dividend capacity, although there is no guarantee that forecast growth is realised or that payout decisions remain unchanged.
Against all of this, the narrative's small 2.7% discount to fair value looks modest. With the stock priced slightly above the SWS DCF estimate and well above the P/E fair ratio, yet still framing as around 3% undervalued on the widely followed narrative, readers are left weighing how much weight to put on SEGRO's physical footprint, data centre optionality and income profile versus the flagged issues around net margins, ROE and balance sheet coverage.
Result: Fair Value of £9.39 (ABOUT RIGHT)
Still, the 5 year total return decline of 20.27% and weaker coverage of debt by operating cash flow could easily challenge confidence in the SEGRO narrative.
Find out about the key risks to this SEGRO narrative.
Another View: SEGRO on Earnings Multiples
Frame the story one way on fair value and SEGRO can look only 3% undervalued. Look instead at its P/E ratio and the picture changes sharply.
The stock trades on 41.5x earnings. The fair ratio sits at 18.5x. Global Industrial REITs cluster around 15.7x and closer peers average 14.2x. That kind of gap points to a rich valuation where even small disappointments in future profit delivery could matter a lot more than they do for cheaper warehouse and data centre landlords.
If the share price moved toward the fair ratio instead of today’s multiple, that would imply a very different outcome to the 3% discount suggested by the fair value narrative. The question for you is straightforward: which version of value deserves more weight when you look at SEGRO today?
See what the numbers say about this price — find out in our valuation breakdown.
Next Steps
Mixed messages around SEGRO often create more questions than answers. This is exactly when it helps to pull up the numbers yourself and pressure test both the bullish and cautious angles. To see the balance of concern and optimism that other investors are flagging, start with these 2 key rewards and 3 important warning signs.
Looking for more investment ideas beyond SEGRO?
If SEGRO has sharpened your focus on quality and valuation, the next smart step is to scan other opportunities before they move out of reach.
- Target resilient potential by zeroing in on companies that score well on debt coverage and liquidity through the 4 resilient stocks with low risk scores.
- Hunt for strong balance sheets and robust fundamentals that could better withstand tougher conditions using the list of solid balance sheet and fundamentals (9 results).
- Spot compelling value candidates where price and quality intersect in a way that might not last with the 5 high quality undiscovered gems.
Have feedback on this article? Concerned about the content? Get in touch with us directly. Alternatively, email editorial-team@simplywallst.com