


EN
Allient Stock Gets A Lift From Earnings Beat
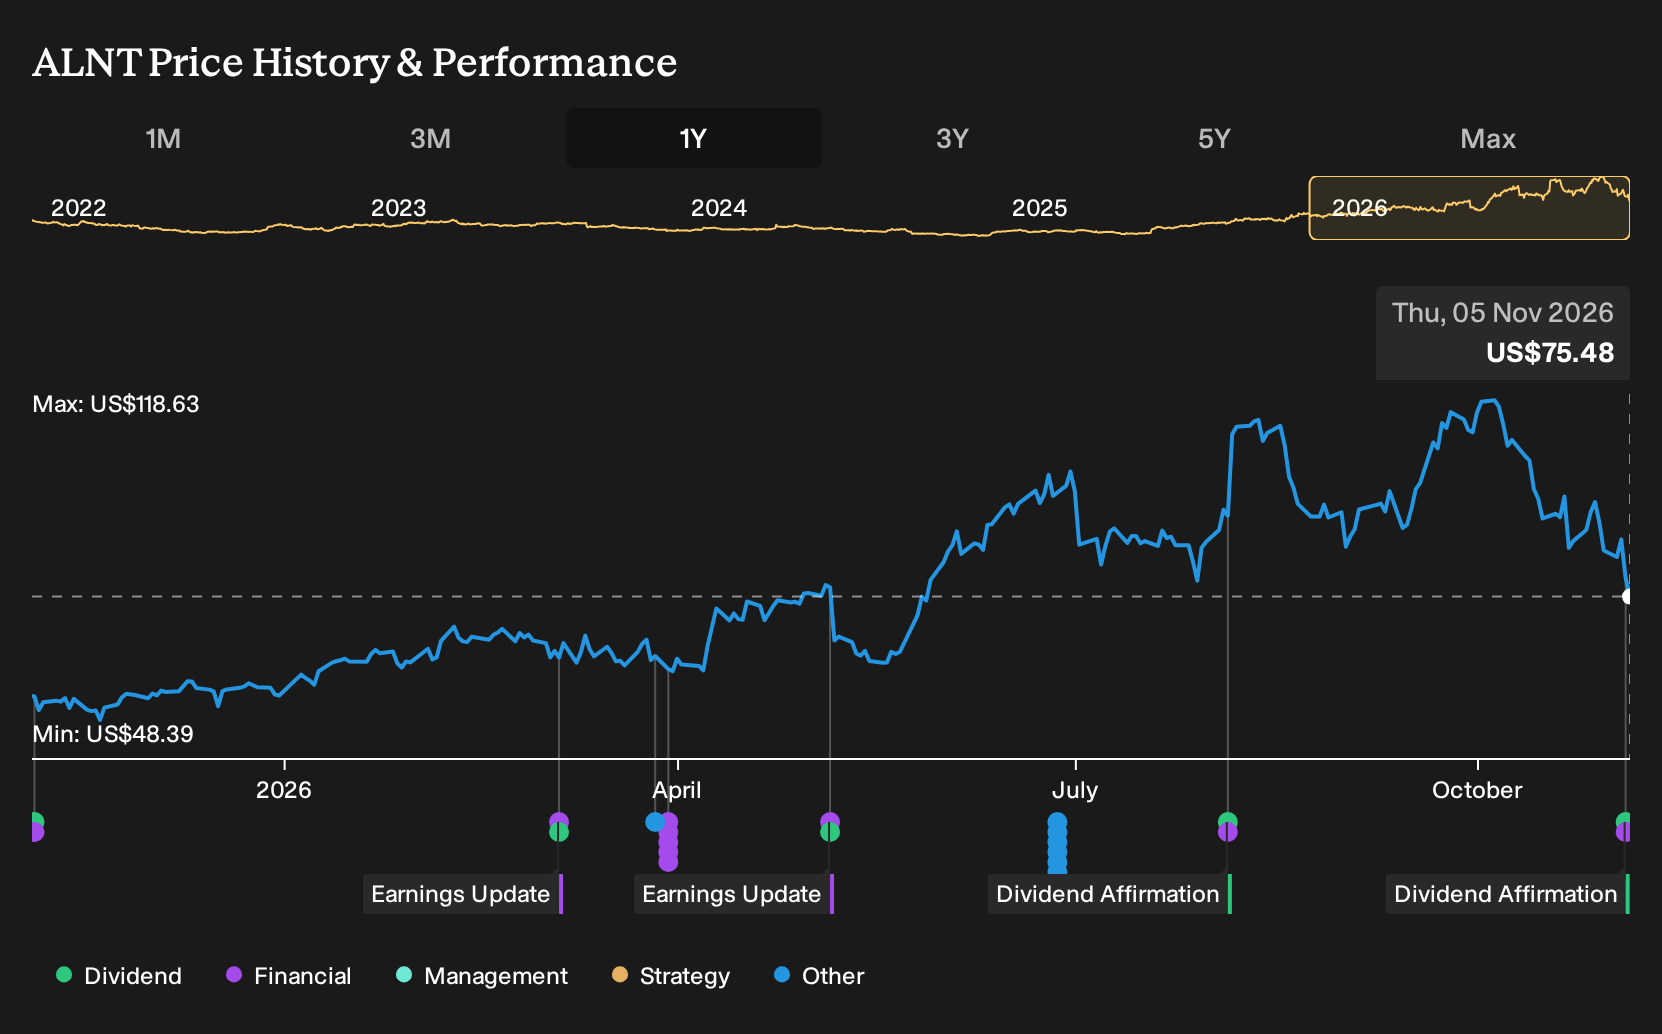
- Allient Inc. reported third quarter 2026 sales of US$164.4 million and net income of US$15.33 million, with basic and diluted EPS from continuing operations of US$0.91. The company also declared a quarterly cash dividend of US$0.04 per share, payable on December 2, 2026, to holders of roughly 17.0 million shares.
- The company’s quarterly EPS of US$1.07 and revenue of US$164.4 million both exceeded analyst estimates, while year to date figures showed higher sales and net income than the prior year period, underscoring how recent execution contributed to reported earnings quality.
- We will now look at how Allient's earnings beat and higher year to date profitability may influence the existing investment narrative.
Scan beyond Allient's earnings beat and dividend update by comparing it with hand-picked peers in the 42 high quality undervalued stocks to see which profiles best fit your portfolio goals.
Allient Investment Narrative Recap
Owning Allient hinges on believing its focus on higher value industrial, data center, medical and defense work can keep turning into solid earnings quality. The latest quarter shows strong profitability, which supports that view. The near term catalyst still sits in converting record bookings and backlog into revenue while keeping operations running smoothly.
The biggest operational risk remains that cost savings from programs like STAN and the Dothan transition taper off, while restructuring expenses or weaker orders creep in. The fresh earnings beat helps confidence but does not remove the possibility that margins or organic demand could soften and pressure results.
Among the recent updates, the third quarter 2026 earnings release matters most for your thesis on Allient. Sales of US$164.4 million and net income of US$15.33 million, together with quarterly EPS from continuing operations of US$0.91 and reported EPS of US$1.07, frame how effectively current demand converts into profit.
This report also ties directly into the key catalysts. Year to date sales of US$457.08 million and net income of US$31.07 million show how the backlog, electrification exposure and higher margin mix are flowing through today. These results still leave questions around execution on restructuring, higher debt, valuation sensitivity and how repeatable these margins may be.
Allient's current analyst story points to revenues of US$727.9 million and earnings of US$56.3 million by 2029. This outlook is built on an assumed 8.2% yearly revenue growth rate and an earnings increase of US$27.7 million from US$28.6 million today.
Uncover why Allient's fair value indicates a 56% potential upside to its current price that could narrow quickly.
Exploring Other Perspectives
Some bullish analysts frame Allient’s data center exposure as the real swing factor. Before this earnings beat and dividend confirmation, the most optimistic forecasts were already calling for revenue of about US$768.4 million and earnings of US$62.1 million by 2029. You can use those richer expectations to test how your own view might shift after this report.
Explore 2 other Allient fair value estimates, including one that suggests there could be as much as 72% upside from the current price!
Form Your Own Verdict
Don't just follow the ticker; dig into the data and build a conviction that's truly your own.
- A great starting point for your Allient research is our analysis highlighting 3 key rewards and 3 important warning signs that could impact your investment decision.
- See our latest analysis for Allient. The report includes a comprehensive fundamental analysis summarized in a single visual, the Snowflake, making it easy to evaluate Allient's overall financial health at a glance.
Looking for more investment ideas beyond Allient?
If you want to pressure test your view on Allient against other potential opportunities, using the Simply Wall St Screener can help you quickly filter for companies that better match your risk appetite, income needs or balance sheet preferences.
- For investors who care most about durable balance sheets and solid fundamentals, start with this list of solid balance sheet and fundamentals (24 results) to see which businesses hold up under closer scrutiny.
- If you want income on top of potential capital returns, focus on companies offering stronger yields and more consistent payouts through the 6 dividend fortresses.
- When the priority is limiting downside risk rather than chasing the highest upside, narrow your search to a 32 resilient stocks with low risk scores that better aligns with a more defensive approach.
Have feedback on this article? Concerned about the content? Get in touch with us directly. Alternatively, email editorial-team@simplywallst.com