


EN
NQ Futures Just Had Its Worst Day Since 2020: Is 27,200 the Line That Decides What Comes Next?
1. Midterms Meet the AI Trade: Why Nasdaq Sellers Took Control
As of November 5, 2026, the Nasdaq 100 fell 6.36%, its worst day since March 2020. The Nasdaq Composite dropped 5.52%, its worst session since April 4, 2025, and closed in correction territory, more than 10% below its October 6 record. The S&P 500 fell about 4.36%, and the Dow lost 1,833 points, erasing all of the 1,569 point gain it posted on Wednesday, November 4.
The catalyst was a sharp reassessment of AI infrastructure risk. Democrats’ midterm gains included the Texas and Ohio governorships, two states with heavy data center development. The Texas governor-elect promised a moratorium on new buildouts until stronger protections are enacted, and the Ohio governor-elect called for conditional pauses. As of November 5, Nvidia fell more than 9% and Micron fell roughly 17%, while declining stocks outnumbered advancing stocks on the Nasdaq by about 5 to 1. The VIX hit its highest level since March 31. This was a clear risk off move, with money leaving chips and AI infrastructure and the Russell 2000 also closing in correction.
Macro conditions add pressure. As of October 28, the Fed held rates at 3.75% to 4% in a 10 to 2 vote, with two officials dissenting in favor of a hike after September’s increase. The 10 year Treasury yield was near 5% that day. As of November 5, CME FedWatch showed roughly an 81.5% probability of a 25 basis point hike at the December 9 meeting. Oil is also in focus. As of November 4, Brent fell about 8.6% to $94.66 intraday on hopes that the midterm results could push Washington toward an Iran deal, and crude rebounded to about $90 on November 5 as ships continued to come under attack in the Persian Gulf.
2. What the Market Has Done
- Since June, the market has been in a sideways consolidation range 2 between 31,000 (Daily level 1) and 27,200 (Daily level 3).
- In August, buyers held bids at 29,000 (Daily level 2) and were able to bid prices up to ATHs. However, this was short lived, as buyers failed to accept higher prices.
- As a result, the market rotated back down into the range.
- From mid to end October, buyers made another attempt to hold bids at 29,000 (Daily level 2) but failed.
- That failure led to a hard selloff, with the market breaking and closing below 27,200 (Daily level 3).
3. What to Expect in the Coming Weeks
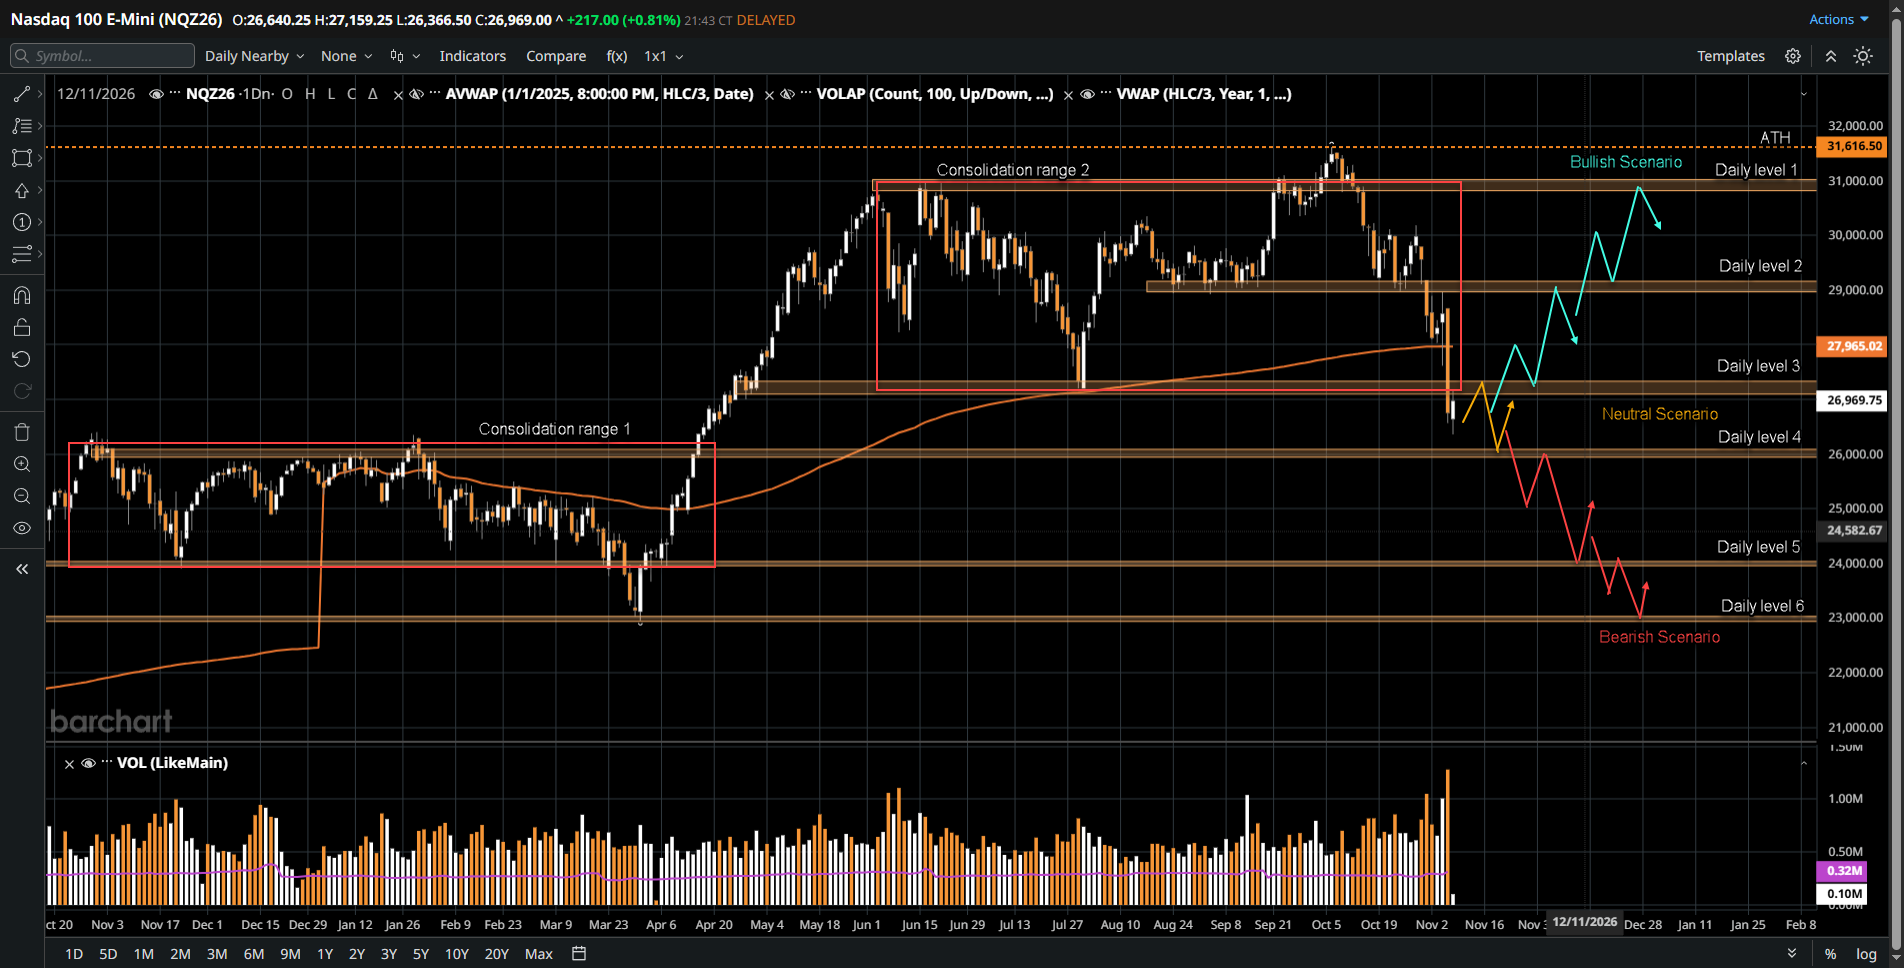
The key level to watch is 27,200 (Daily level 3). The scenarios below are framed for the next few weeks to a month.
Neutral Scenario
- After a large selloff, expect the market possibly to auction two-way between 27,200 and 26,000 (Daily level 4) to re-establish value before a subsequent directional resolution.
- A possible supporting condition for this scenario is a mixed macro backdrop, where the Fed keeps its data dependent tone, and Iran talks stay unresolved without a clear breakthrough or breakdown.
Bullish Scenario
- If buyers are able to reclaim and accept back above 27,200, expect a possible move up to 29,000 (Daily level 2), where sellers are expected to respond.
- If sellers do not respond there, expect a possible move up to the 31,000 area (Daily level 1).
- A possible trigger is a credible US and Iran agreement that reopens the Strait of Hormuz, pulling oil and Treasury yields lower, alongside clarity that state level data center politics will not slow the AI buildout.
Bearish Scenario
- If buyers are not able to hold bids at 26,000 (Daily level 4), expect a possible move down through consolidation range 1 to 24,000 (Daily level 5).
- If buyers are not able to defend that level, expect a possible further move down to 23,000 (Daily level 6).
- A possible trigger is a hot jobs or inflation print that locks in a December hike while 10 year yields push back above 5%, combined with new data center restrictions or renewed attacks on Gulf shipping that send oil higher.
4. Conclusion
Technically, NQ futures have broken a range that held since June, and 27,200 (Daily level 3) is the line that separates a rebound attempt from further downside. Fundamentally, the market is balancing an AI trade facing new political risk, a Fed that has hiked once and may hike again, and an Iran conflict that keeps oil and yields unpredictable. Watch how price behaves around 27,200 as the jobs report, Fed minutes on November 18, and Iran headlines arrive. Do you think the AI trade can absorb a regulatory shock, or is this the start of a deeper reset?
We provide the infrastructure you need to quantify your discipline and ensure every decision is backed by the confidence of seeing exactly what drives your performance. Start trading with the clarity you deserve. Open an Account today.
Disclaimer:
This article is provided for informational and educational purposes only and does not constitute financial, investment, or trading advice. The analysis presented reflects the author’s market observations and opinions at the time of writing and is not a recommendation to buy or sell any futures contract, security, or financial instrument. Futures trading involves significant risk and is not suitable for all market participants. Losses may exceed initial margin deposits, and market conditions can change rapidly.
Any scenarios, levels, or market expectations discussed are hypothetical in nature and are intended solely to illustrate potential market behavior. They do not represent actual trading results and should not be interpreted as guarantees of future performance. Past performance, market behavior, or historical price action are not indicative of future outcomes.
Readers are solely responsible for their own trading decisions and risk management. Always conduct independent research, consider your financial situation and risk tolerance, and consult with a qualified financial professional, if necessary, before engaging in futures or derivatives trading.