


EN
Quebecor (TSX:QBR.A) Posts Strong Q3 Wireless Growth, Is The Valuation Still Attractive?
Quebecor (TSX:QBR.A) just delivered third quarter results that put its wireless business front and center, with record mobile subscriber additions, higher consolidated EBITDA, lower leverage and more cash being returned to shareholders through dividends and buybacks.
The latest quarter has clearly caught investors’ attention, with Quebecor’s 1-day share price return of 3.38% at CA$70.94 capping a 7-day move of 6.32% and a 30-day share price return of 9.66% that signals building momentum. Over a longer stretch, the stock’s 34.61% year to date share price return sits alongside a 1-year total shareholder return of 50.22% and a 3-year total shareholder return of 138.59%. This performance aligns with the stronger earnings, higher free cash flow, dividend increase and renewed buyback activity investors have been digesting around these results.
Scan Quebecor's momentum and cash generation against a hand-picked 6 high quality undervalued stocks that also combine strong balance sheets with robust cash flows.The share price has already run hard on Quebecor’s wireless surge and richer payouts, yet a discounted cash flow model still points to value above today’s CA$70.94. How much of that gap feels justified now?
Preferred P/E of 16.8x: Is it justified for Quebecor?
On simple earnings metrics, Quebecor does not look cheap. The stock trades on a P/E of 16.8x, above both its peer average of 14.4x and the global telecom group at 14.9x, even though the SWS DCF model suggests the shares trade at a 14.1% discount to its estimated future cash flow value of CA$82.62 versus the current CA$70.94.
The P/E ratio measures what investors are willing to pay today for each dollar of current earnings. For a mature telecom and media operator like Quebecor, it often reflects what the market expects for future profit growth, cash conversion and capital intensity rather than rapid top line expansion.
Here, the gap is clear. The stock sits on a richer earnings multiple than sector and peer averages, while earnings are forecast to rise 7.7% per year and revenue is projected to grow 2.6% annually, which is slower than the wider Canadian market on both counts. That combination suggests investors are paying up for high quality earnings, improved profit margins and a 2.54% dividend with a strong recent return profile, rather than for outsized future growth that would pull the P/E lower toward the estimated fair P/E of 12.4x.
The comparison with other telecom groups is even starker. Quebecor trades at 16.8x earnings compared with the global telecom industry at 14.9x, so the valuation is materially richer than sector norms. The fair P/E of 12.4x points to a level the market could shift toward if enthusiasm around recent results cools or if profit expansion tracks closer to current forecasts instead of the faster pace seen over the past year.
Explore the SWS fair ratio for Quebecor.
Result: Price-to-earnings of 16.8x (OVERVALUED)
Still, Quebecor’s premium P/E could come under pressure if wireless momentum slows or if higher capital needs reduce free cash flow and shareholder returns.
Find out about the key risks to this Quebecor narrative.
Another View On Quebecor Using Cash Flows
Earnings multiples say Quebecor looks expensive, yet the SWS DCF model points the other way. With the shares at CA$70.94 and an estimated future cash flow value of CA$82.62, the model suggests the stock trades at a 14.1% discount. Which signal should carry more weight for you?
Look into how the SWS DCF model arrives at its fair value.
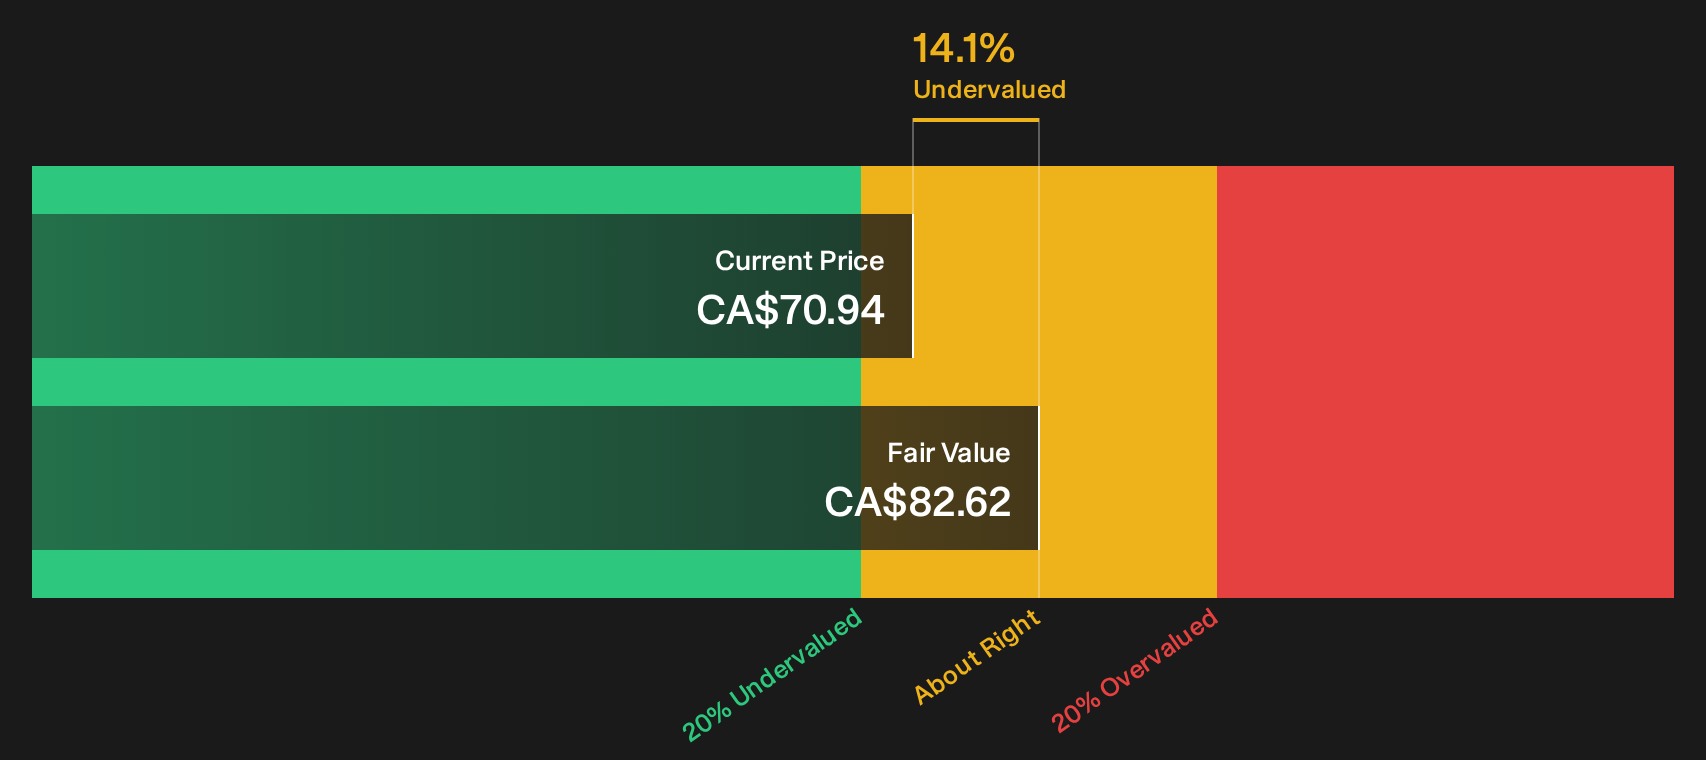
Simply Wall St performs a discounted cash flow (DCF) on every stock in the world every day (check out Quebecor for example). We show the entire calculation in full. You can track the result in your watchlist or portfolio and be alerted when this changes, or use our stock screener to discover 6 high quality undervalued stocks. If you save a screener we even alert you when new companies match - so you never miss a potential opportunity.
Next Steps
With Quebecor’s mixed signals on valuation and sentiment, you probably want to see both sides of the story for yourself. Move quickly and weigh the upside against the downside by checking the 4 key rewards and 1 important warning sign
Looking for more investment ideas beyond Quebecor?
If you stop with Quebecor, you only see part of the opportunity set. Broader ideas help you compare quality, price and risk across very different businesses.
- Target resilience by reviewing companies with strong financial footing in the list of solid balance sheet and fundamentals (5 results).
- Spot potential mispricing by scanning the 6 high quality undervalued stocks that match your quality and value filters.
- Hunt for overlooked potential by checking the 7 high quality undiscovered gems before others start paying attention.
Have feedback on this article? Concerned about the content? Get in touch with us directly. Alternatively, email editorial-team@simplywallst.com