


EN
BGC Group (BGC) Posts Stronger Third Quarter Earnings, Is The Stock Now Too Expensive?
BGC Group (BGC) is back in focus after third quarter earnings on 5 November 2026, with revenue of US$832.56 million and net income of US$71.29 million drawing fresh investor scrutiny.
The share price reaction has been harsh in the short term, with BGC Group stock down 7.2% on the day and 7.4% over the past month. However, the 17.0% year-to-date share price return and 118.27% five-year total shareholder return suggest longer-term momentum has been strong.
Scan how BGC Group compares with other financial firms showing strong recent momentum and solid fundamentals through our curated list of 21 high quality undiscovered gems
So is the slide after these stronger earnings and leadership changes telling you something new about BGC Group’s business, or mostly about shifting mood around the stock? And how does the current price stack up against the numbers?
Price-to-Earnings of 26.1x: Is it justified?
BGC Group last closed at $10.46, and the key question now is whether that price fairly reflects what investors are paying for each dollar of earnings through its P/E ratio.
The P/E multiple compares the share price to earnings per share, so it effectively shows how many dollars investors are willing to pay for $1 of current profit. For a diversified financial brokerage and technology group like BGC Group, which runs trading, market data, and infrastructure services across multiple regions, this metric often captures what the market thinks about the durability and quality of those earnings streams.
Against its immediate peer set, the picture is less comfortable. BGC Group trades on a P/E of 26.1x, while peers average 16.7x. That is a much richer earnings tag than similar companies are getting, which suggests the stock price is baking in stronger profitability or resilience than the peer group. In comparison, the broader US Capital Markets industry has an average P/E of 36.7x, so BGC Group looks cheaper, since investors in the wider sector are paying significantly more for each dollar of earnings.
See what the numbers say about this price — find out in our valuation breakdown.
Result: Price-to-Earnings of 26.1x (ABOUT RIGHT)
Still, revenue that declined 2.3% over the past year and an annual net income trend that is not clearly positive leave room for sentiment around BGC Group to shift quickly.
Find out about the key risks to this BGC Group narrative.
Another View: What The DCF Model Says About BGC Group
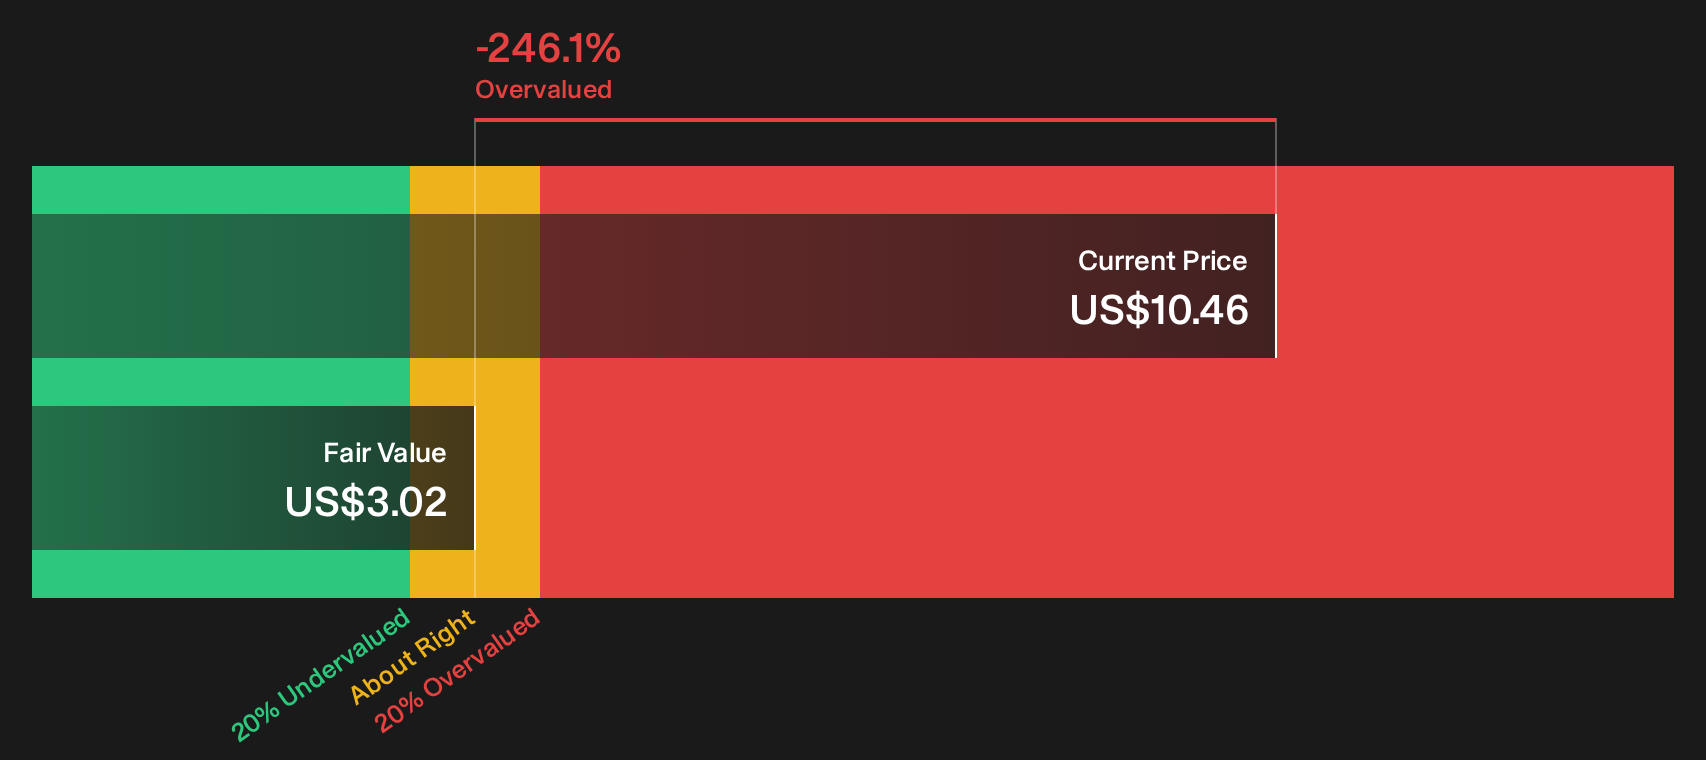
The SWS DCF model looks at BGC Group through future cash flows rather than current earnings and arrives at an estimate of $3.02 per share. With the stock at $10.46, that gap points to an overvalued reading on this framework and raises a different set of questions about risk.
For investors who lean on cash flow based valuation, it can be useful to walk through how this result is built and what would need to change in the inputs to narrow that gap. Look into how the SWS DCF model arrives at its fair value.
Simply Wall St performs a discounted cash flow (DCF) on every stock in the world every day (check out BGC Group for example). We show the entire calculation in full. You can track the result in your watchlist or portfolio and be alerted when this changes, or use our stock screener to discover 42 high quality undervalued stocks. If you save a screener we even alert you when new companies match - so you never miss a potential opportunity.
Next Steps
Mixed feelings about BGC Group after these results are understandable, and the fastest way to cut through that noise is to inspect the numbers yourself, then weigh the 2 key rewards and 2 important warning signs.
Looking for more investment ideas beyond BGC Group?
If BGC Group has your attention but you want a wider watchlist, use the Simply Wall St screener to spot fresh ideas before everyone else does.
- Target resilient performers that aim to balance growth with capital protection by scanning a curated pool of 32 resilient stocks with low risk scores.
- Hunt for quality businesses that trade below their estimated worth and may offer a margin of safety through the 42 high quality undervalued stocks.
- Spot quieter opportunities with solid fundamentals that are not widely followed yet by checking the 21 high quality undiscovered gems.
Have feedback on this article? Concerned about the content? Get in touch with us directly. Alternatively, email editorial-team@simplywallst.com