


EN
ServiceNow (NOW) Could Be 34% Undervalued On Its NBA Workflow Expansion
ServiceNow (NOW) just deepened its relationship with the NBA as Official Employee Workflow Partner, with the league rolling out ServiceNow EmployeeWorks to centralize onboarding and day to day internal service requests on a single platform.
That NBA announcement lands against a weak tape for ServiceNow. The share price is at US$102.36 after a 1-day share price return of down 5.93%, capping a tough run that includes a 30-day share price return of down 25.81% and a year-to-date share price return of down 30.58%, while the 1-year total shareholder return is down 40.40% and the 3-year total shareholder return is down 17.42%. This signals fading momentum even as recent client wins, AI partnerships and product launches keep ServiceNow in the middle of many large workflow and automation decisions.
Scan beyond ServiceNow and see how other workflow and AI platforms are repricing after the recent software selloff with a curated set of 42 high quality undervalued stocks.
ServiceNow’s slide has come alongside new partnerships, product announcements and fresh guidance. Is this drop a verdict on the business itself, or mainly a reset in how investors want to price it?
Most Popular Narrative: 33.5% Undervalued
ServiceNow last traded at $102.36, while the most followed narrative on the stock pegs fair value at $154, framing the latest slide as a pricing reset rather than a verdict on the business.
The market may still see a software company.
I increasingly see a utility for the digital economy.
See why 96 investors see ServiceNow as 34% undervalued.
That narrative, according to John_Eric, rests on ServiceNow’s role in workflow automation and AI governance, not just on a label as another software vendor. The argument is that a platform woven into HR, IT, security, compliance and employee workflows can become infrastructure that customers treat as essential, which is a different story to one about a discretionary tool that can be easily swapped out.
At the same time, the narrative does not ignore pressure points. Recent figures show Return on Equity at 11%, which is described as low relative to a 20% threshold, net profit margins at 9.4% compared with 13.7% a year earlier, and earnings that declined 16.5% over the last year, even though they grew 30.9% per year over the last five years. Forecasts now point to earnings growth of 30.2% per year and revenue growth of 16.1% per year, both faster than the wider US market according to the data provided.
Valuation work behind that $154 fair value uses a discount rate of 8.63% and treats ServiceNow as an owner cash flow story, not just a high P/E stock. That view sits alongside Simply Wall St’s own SWS DCF model, which separately estimates future cash flow value at $223.91 per share, implying the current $102.36 price is well below that modelled cash flow stream. Both approaches highlight a gap between recent share price performance, with the 1-year total return down 40.4%, and the implied value of future cash generation if forecasts are met.
For investors weighing that gap, the narrative also flags risks that can shift the fair value over time. Slower revenue growth than 20% per year, margin pressure, high stock based compensation, an inexperienced management team with 1.8 years average tenure and CEO pay of $51.55m that rose while earnings fell more than 20% are all cited as factors that could limit eventual shareholder returns if they persist. On the other side of the ledger, high quality earnings, a forecast Return on Equity of 21.7% within three years and the absence of low risk customer deposit funding keep attention on cash generation, balance sheet structure and capital allocation.
Result: Fair Value of $154 (UNDERVALUED)
Still, the ServiceNow narrative can crack if revenue growth slows toward the low end of expectations or if rich stock based compensation continues to weigh on shareholder returns.
Find out about the key risks to this ServiceNow narrative.
Another View On ServiceNow: Expensive On Earnings
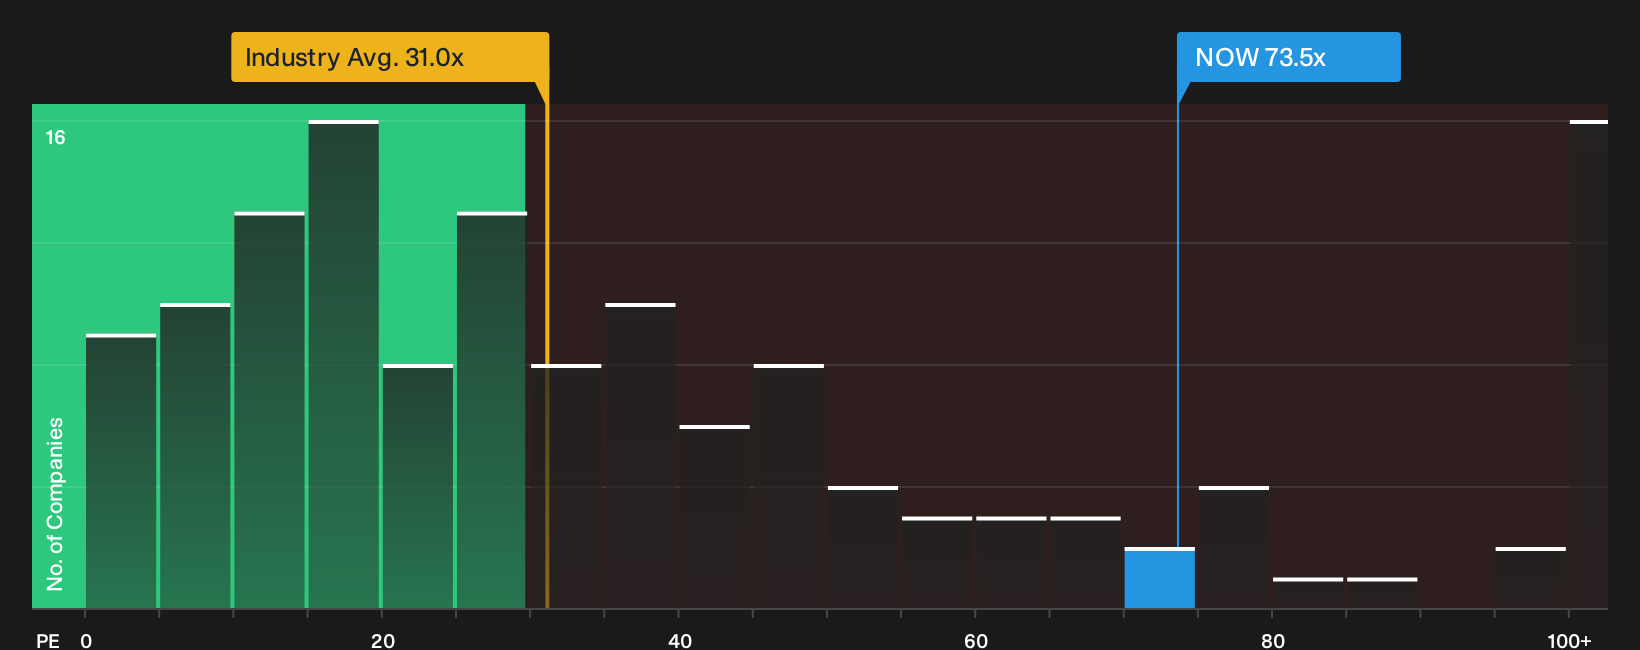
If the narrative and cash flow work suggest ServiceNow looks cheap, the simple earnings math tells a different story. The stock trades on a P/E of 73.5x, compared with a fair ratio of 58.8x, an industry average of 31x and a peer average of 24.5x.
That gap implies investors are paying a premium price for each dollar of current earnings, even after the share price slide. The question is whether future profit growth and AI execution justify that richer multiple or leave late buyers exposed if sentiment cools.
See what the numbers say about this price — find out in our valuation breakdown.
Next Steps
If the split between pressure points and bright spots in ServiceNow leaves you unsure, consider taking the time to review the numbers yourself and form a personal view using 2 key rewards and 2 important warning signs.
Looking for more investment ideas beyond ServiceNow?
Do not stop with one stock. Use tailored screeners to quickly surface fresh ideas that match your preferred mix of quality, risk and income potential.
- Target steadier rides by reviewing companies that score well on resilience using the 32 resilient stocks with low risk scores.
- Hunt for underappreciated opportunities by scanning the 21 high quality undiscovered gems before the wider market pays attention.
- Strengthen your core holdings by focusing on balance sheet quality through the list of solid balance sheet and fundamentals (25 results).
Have feedback on this article? Concerned about the content? Get in touch with us directly. Alternatively, email editorial-team@simplywallst.com