


EN
Uber Technologies Delivers Strong FCF - What's the Best UBER Play?
Uber Technologies (UBER) delivered strong Q3 revenue, free cash flow (FCF), and FCF margins in its Nov. 4 earnings release. Analysts also have higher 2027 revenue forecasts, implying a higher valuation for the company. This article looks at some of the best UBER plays for investors.
UBER closed down slightly at $68.78 (-1.5%) on Nov. 5 after the results. It's still up from a pre-earnings low of $65.25 on Oct. 30, but well off its recent Aug. 25 peak of $80.35.
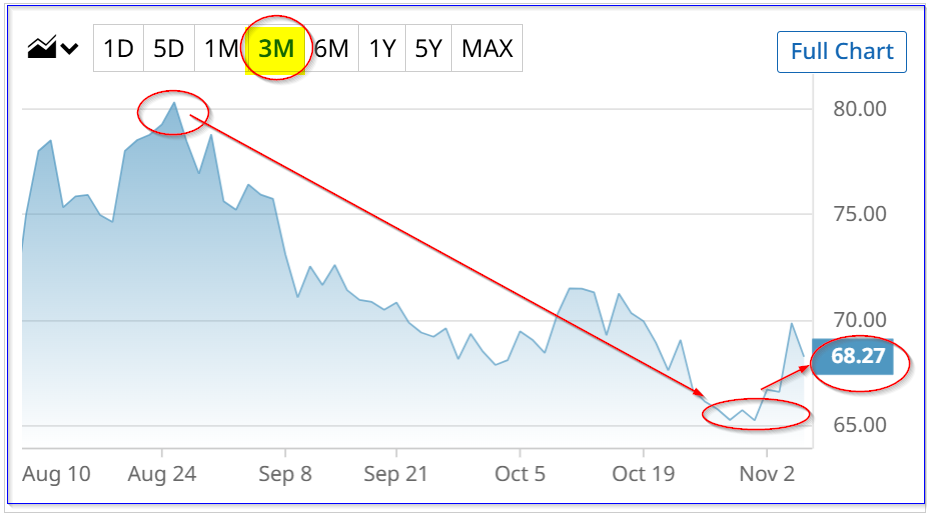
It could be worth much more. I discussed its valuation in a Barchart article, “Unusually Heavy Options Trading in UBER Ahead of Earnings - Are Investors Bullish on UBER?” (Oct. 21).
Its results yesterday confirm that UBER could easily be worth almost $86 per share (i.e., +25%). Here's why.
Strong FCF Results
People still love using UBER rides. Q3 bookings were up 20%, and revenue rose 10% YoY. Moreover, free cash flow (FCF) gained 13.68% to $2.535 billion. That represented 17.17% of revenue, which was higher than last year's 16.56% FCF margin, according to Stock Analysis data.
Moreover, the company showed that its trailing 12-month (TTM) revenue (which helps account for seasonality issues) rose 20.3% to $10.4 billion. That was above the Q2 TTM $10.1 billion (see page 26 of UBER's supplemental deck).
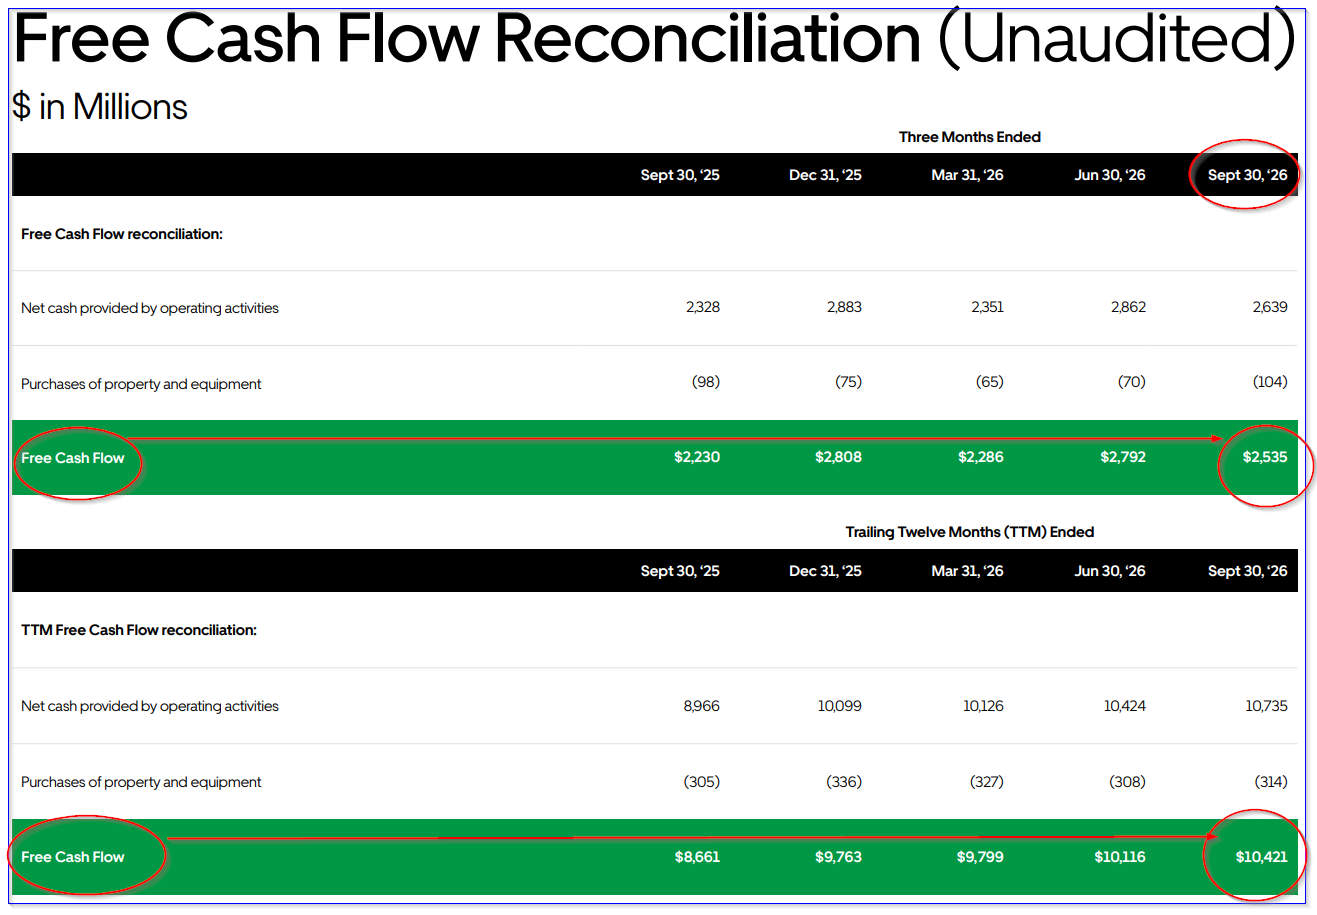
More importantly, its TTM FCF margin rose to 18.44% from 17.36% last year and 18.32% in Q2, according to Stock Analysis data.
If UBER can maintain this margin growth as its revenue rises, FCF will continue to rise, pushing up the value of UBER stock.
Higher Valuation Possible
Analysts now project next year's revenue will rise 15.35% from $57.85 billion in 2026 to $66.73 billion (Seeking Alpha) in 2027.
So, if UBER maintains an 18.44% FCF margin, FCF will exceed $12 billion:
$66.73b x 0.1844 = $12.3 billion FCF 2027 est.
That is 18.3% above its Q3 TTM $10.4 billion. In other words, the stock could be worth significantly more. How much?
For example, using a 7% FCF metric (i.e., 14.3x FCF):
$12.3 b x 14.3 = $175.9 billion value
That's $35 billion more than its present $140.5 billion market cap (i.e., +25% higher).
In other words, the price target (PT) is 25% higher:
$68.78 x 1.25 = $85.98 PT
Yahoo! Finance's survey is much higher at $100.77, based on 50 analysts, and Barchart's mean survey PT is $102.05. These targets imply upside of over +47% ($101.44 avg PT).
The bottom line is that UBER stock looks deeply undervalued. Here are some ways to play UBER.
Sell Short OTM UBER Puts
Investors can sell short out-of-the-money puts with a nearby expiration. This lets the investor set a slightly lower buy-in point and collect income upfront.
For example, the Dec. 4 expiry period shows that the $66.00 put strike price (3.5% lower or out-of-the-money) has a midpoint premium of $1.64.
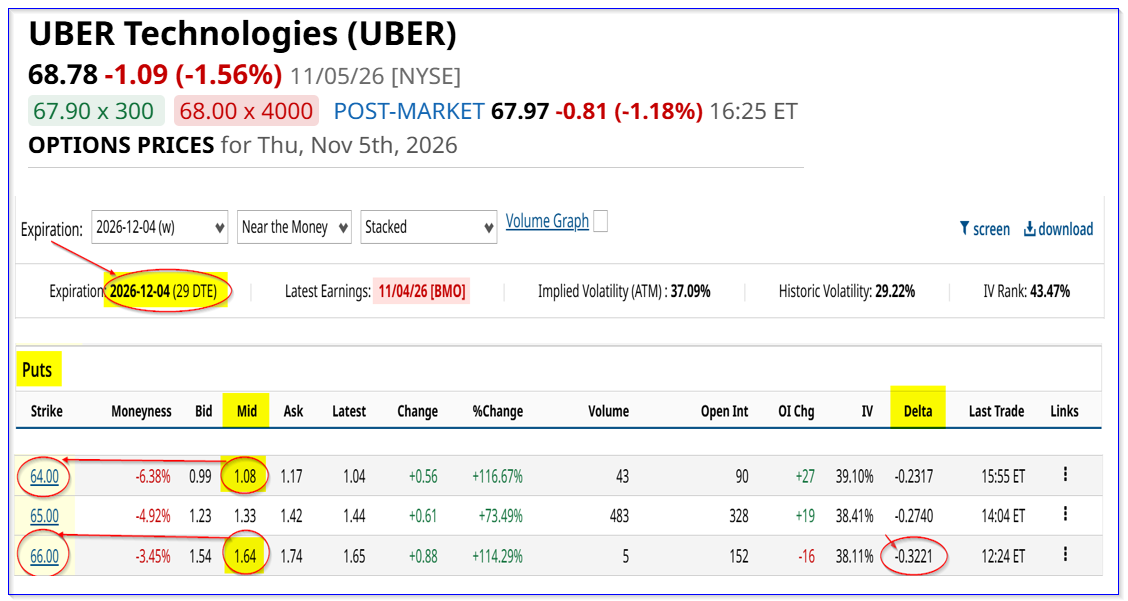
This means a short-seller of these puts has an obligation to buy 100 shares at $66.00 if UBER falls to that price. The brokerage firm requires $6,600 in collateral (in cash or buying power).
So, the effective yield expected is $164/$6,600, or 2.485% for the next month.
That is an attractive expected return (ER), especially if an investor repeats it for the next 3 months, i.e., 7.455%.
In addition, if the stock falls to $66.00, the breakeven cost is $6,436 ($6,600 - $164), or $64.36. So, if UBER rises to $86, the ER is +33.6%. The worst that happens is the investor has an unrealized loss after assignment.
UBER Put Credit Spread
Another play, albeit with more risk but much higher returns, is to do a put credit spread. Here, the investor would short the $66 put and also buy a put at a lower strike price, say at $64.
The net credit collected in this example is: $164 - $108 = $56
But the expected collateral is $66-$64 x 100, or $200. That's much lower than the $6,600 collateral required for the short-put play. But the expected return (ER) is much higher:
$56/ ($200 - $56) = $56/$144 (at-risk capital) = 38.9%
So, for example, the investor could do 3 put credit spreads and make a similar dollar amount as the short put play (i.e., $56 x 3 = $168). But the ER is much higher at 38.9%:
$168 / ($600 - $168) = $168 / $432 = 38.9% ER
In other words, with 11x less collateral (i.e., $600 vs. $6,600), the investor makes a similar dollar return and a much higher ER.
However, with higher return, there is higher risk. For example, if UBER falls to $64.00, 100% of the collateral will be lost. The breakeven point is $67.44 ($68-$0.56), or 1.95% lower.
Long-Dated ITM Call Option Purchase
In this play, the investor buys a much longer-dated call option at a strike price that is in-the-money (ITM). This can also be done along with the other two plays.
For example, the June 17, 2027, expiry period shows that the $165.00 call option has a midpoint premium of $10.90.
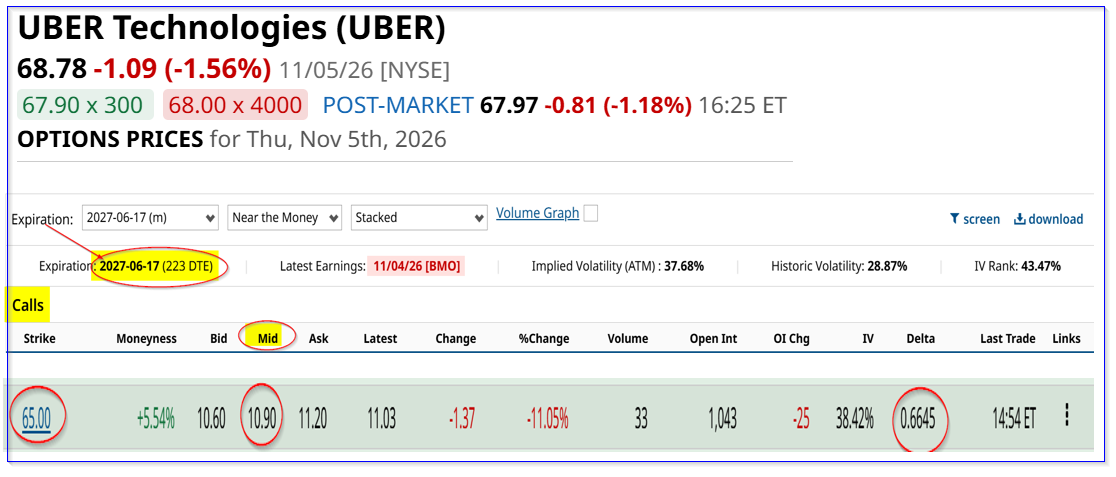
In other words, it would cost just $1,090 to buy 100 shares at $65.00, i.e., an all-in cost of $7,590 (i.e., $75.90). The advantage is that there are over 7 months for this to work out.
Moreover, if the investor can make $164 each month for 7 months by shorting puts (or put credit spreads), the call premium could be more than paid for:
7 x $165/mo = $1,148
In other using all of these methods, the investor has a chance for a very low-cost upside play in UBER stock.
On the date of publication, Mark R. Hake, CFA did not directly have a position in any of the securities mentioned in this article. All information and data in this article is solely for informational purposes. For more information please view the Barchart Disclosure Policy here.