


EN
THOR Industries (THO) Following A 26% Jump Is The Premium P E Too Pricey
THOR Industries (THO) is back in focus after a recent rebound in its share price following a difficult year, as investors reassess whether a premium P/E multiple matches the company’s earnings power.
The recent 1-month share price return of 25.89% and 7-day gain of 19.12% suggest momentum is rebuilding for THOR Industries, even though its year-to-date share price return is down 19.71% and the 1-year total shareholder return has declined 16.59%.
Compare THOR Industries' premium P/E with a curated 35 high quality undervalued stocks that still trade without demanding the same valuation mark up.
For THOR Industries, a 25.89% 1‑month jump after a year of weaker returns can signal a business story finally getting credit or just a swing in mood. What are you really paying for at this valuation?
Price-to-Earnings of 24.6x: Is it justified?
On current numbers, THOR Industries is being valued on a premium P/E of 24.6x, which sits well above both peer and industry averages, while the last close sits at $84.65. That suggests investors are paying up relative to other auto stocks that have lower valuations on the same earnings yardstick.
The P/E ratio compares what the market is willing to pay for each dollar of earnings. For a manufacturer like THOR Industries, where profitability has been under pressure and earnings have declined by 34.9% per year over the past 5 years, a higher multiple usually reflects confidence that profits will look very different to recent history.
THOR Industries is trading on a richer earnings multiple than two reference points. The stock is described as expensive versus the Global Auto industry average P/E of 14.1x. It is also labelled expensive against a peer average of 19.7x. In addition, the estimated fair P/E for THOR Industries is 16.9x, which is well below the current 24.6x level and points to a valuation the market could move toward if sentiment cools or earnings do not keep pace with expectations.
Explore the SWS fair ratio for THOR Industries.
Result: Price-to-Earnings of 24.6x (OVERVALUED)
Still, the narrative can unravel quickly if THOR Industries’ premium P/E meets softer RV demand, or if dealer inventories stay elevated and pressure future earnings expectations.
Find out about the key risks to this THOR Industries narrative.
Another View: What Our DCF Model Says About THOR Industries
The SWS DCF model points in a very different direction for THOR Industries. In this view, the estimated future cash flow value sits at $29.39 per share, far below the recent $84.65 price. That indicates a stock our model treats as heavily overvalued. Which signal do you trust more: earnings multiple or cash flow math?
Look into how the SWS DCF model arrives at its fair value.
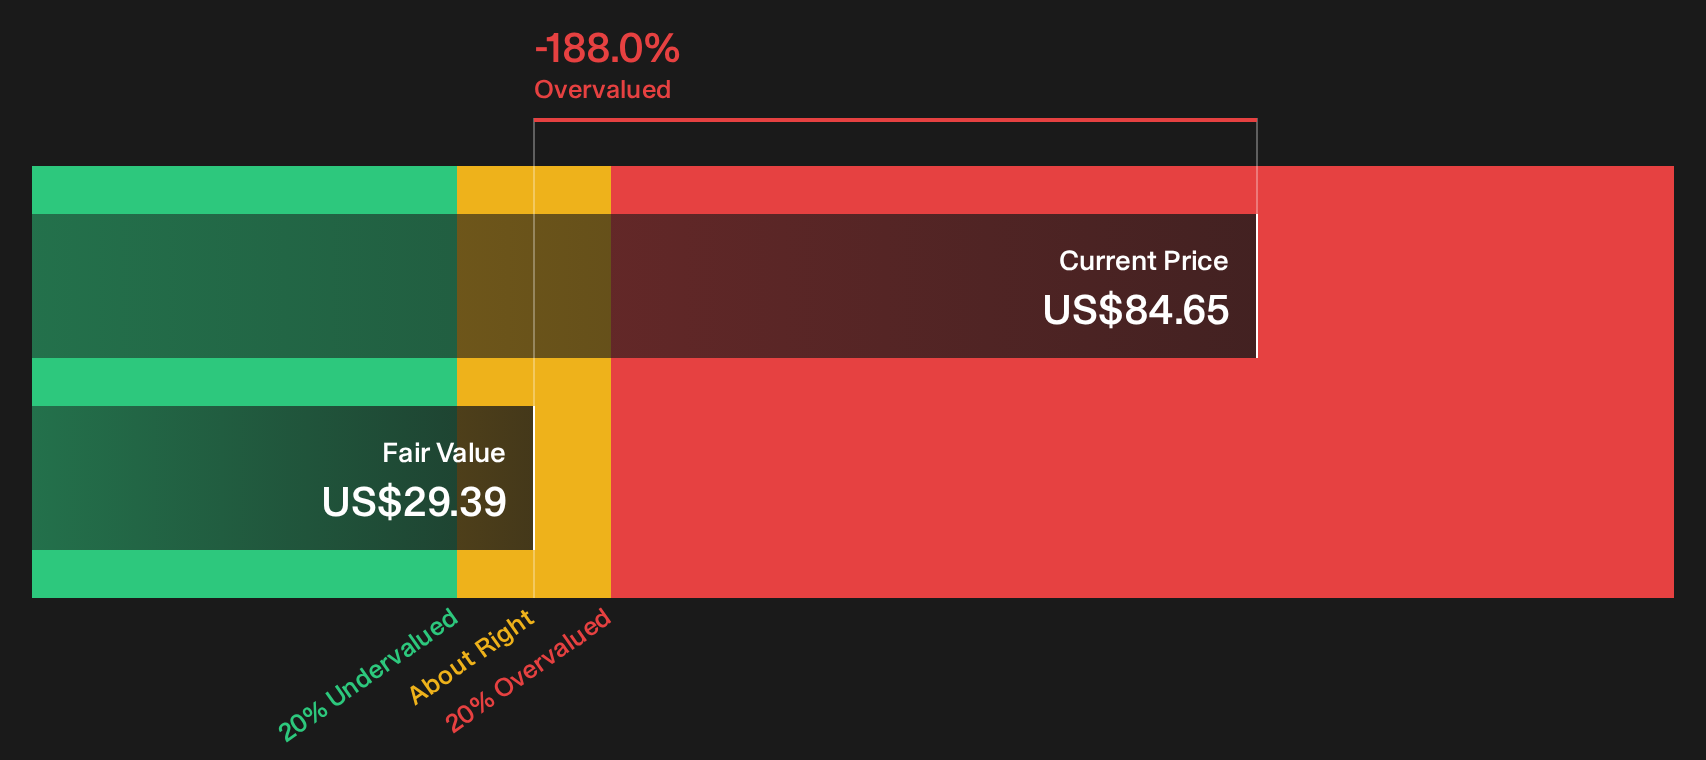
Simply Wall St performs a discounted cash flow (DCF) on every stock in the world every day (check out THOR Industries for example). We show the entire calculation in full. You can track the result in your watchlist or portfolio and be alerted when this changes, or use our stock screener to discover 35 high quality undervalued stocks. If you save a screener we even alert you when new companies match - so you never miss a potential opportunity.
Next Steps
Still not sure whether current optimism around THOR Industries is justified or stretched? Act while the data is fresh and weigh both sides by checking the detailed breakdown of 2 key rewards and 1 important warning sign.
Looking for more investment ideas beyond THOR Industries?
If THOR Industries has you thinking harder about valuation, do not stop here. Use fresh data to hunt for other opportunities before they slip away.
- Target sturdier portfolios by focusing on balance sheet strength and cash flow resilience through a curated list of solid balance sheet and fundamentals (24 results).
- Hunt for mispriced opportunities where quality and price still line up by scanning a focused 19 high quality undiscovered gems.
- Prioritize sleep-at-night holdings with steadier risk profiles using a refined 31 resilient stocks with low risk scores.
Have feedback on this article? Concerned about the content? Get in touch with us directly. Alternatively, email editorial-team@simplywallst.com