


EN
General American Investors Company (GAM) Following Steady Trading Looks Undervalued At $64
General American Investors Company (GAM) continues to trade with a sizeable intrinsic discount of about 55%, which puts fresh attention on how investors weigh its closed end fund structure against its long, multi decade history.
Recent trading has been steady rather than explosive, with the share price at $64.69 and short term moves relatively contained. A 9.98% year to date share price return and a 14.26% one year total shareholder return show momentum that still leans positive, even after a 3 year total shareholder return of a little over 2x.
Scan beyond General American Investors Company and compare its discount-driven profile with a curated set of other value opportunities in our 35 high quality undervalued stocks.
General American Investors Company now trades near $64 with a wide intrinsic discount and a strong recent total return record. Does that justify buying the closed end fund today, or is it better to wait for an even wider gap to value?
Price-to-Earnings of 4.2x: Is it justified for General American Investors Company?
On a simple yardstick, General American Investors Company screens as inexpensive. A P/E of 4.2x at a share price of $64.69 sits well below both its Capital Markets peers and the broader US industry averages, which signals that investors are paying comparatively little for each dollar of recent earnings.
The P/E ratio links the current share price to earnings per share, so it effectively tells you how much the market is willing to pay for the fund's underlying profit stream. For a closed end fund like General American Investors Company, that can reflect the market's view on the quality and repeatability of investment gains as much as traditional operating performance.
Recent profit trends help frame that low multiple. Earnings grew by 91.8% over the past year and have risen by 17.2% per year over the last 5 years, with net profit margins now higher than a year ago and recent growth ahead of the wider Capital Markets sector. At the same time, those figures are influenced by a large one off gain of $377.9m and the presence of sizeable non recurring items in the latest 12 month numbers, so the raw P/E may exaggerate how cheap the stock looks if those items are not repeatable.
Set against that, the gap to peers is wide. General American Investors Company trades on a 4.2x P/E compared with 37.1x for the US Capital Markets industry and 23.6x for its direct peer set, which is a steep discount on both measures. That suggests the market is either heavily discounting the sustainability of recent earnings, or has not fully repriced the stronger multi year profit record and improved margins.
See what the numbers say about this price — find out in our valuation breakdown.
Result: Price-to-Earnings of 4.2x (UNDERVALUED)
Still, the 55% intrinsic discount and reliance on a large one off gain leave General American Investors Company exposed if future investment results or sentiment soften.
Find out about the key risks to this General American Investors Company narrative.
Another view on General American Investors Company’s value
The low 4.2x P/E points in one direction, but the SWS DCF model suggests a different picture. On this approach, General American Investors Company at $64.69 screens as undervalued against an estimated future cash flow value of $143.87, which implies a much wider gap than the earnings multiple alone indicates.
This kind of difference raises a practical question for investors: should more weight be placed on the clearer, headline P/E, or on a cash flow estimate that incorporates assumptions about the future, particularly given the impact of one-off items on the latest results?
Look into how the SWS DCF model arrives at its fair value.
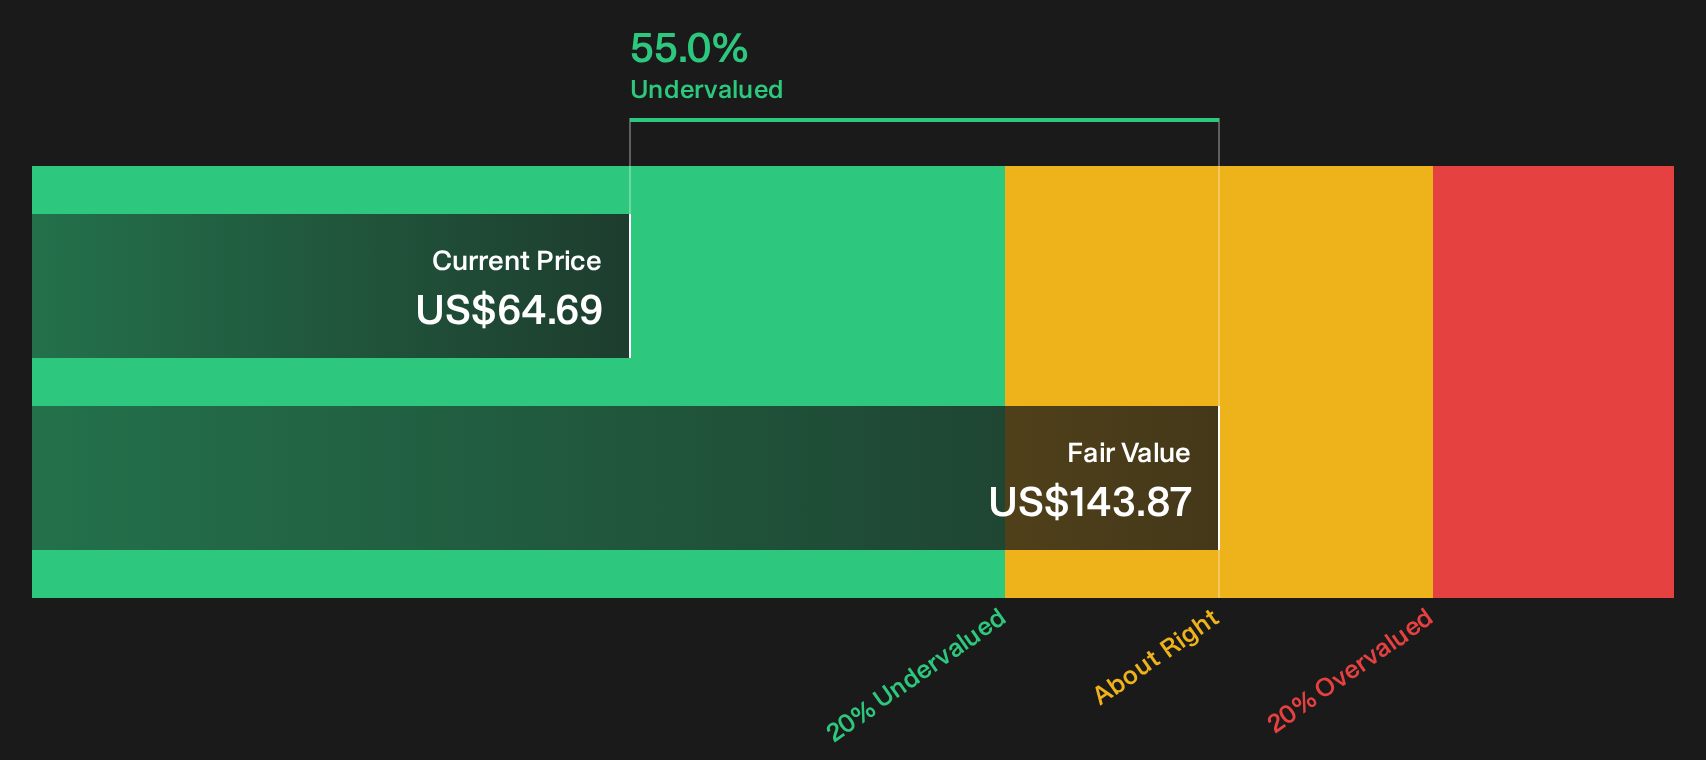
Simply Wall St performs a discounted cash flow (DCF) on every stock in the world every day (check out General American Investors Company for example). We show the entire calculation in full. You can track the result in your watchlist or portfolio and be alerted when this changes, or use our stock screener to discover 35 high quality undervalued stocks. If you save a screener we even alert you when new companies match - so you never miss a potential opportunity.
Next Steps
Seen enough to sense how split the picture is around General American Investors Company, with steep discounts on one side and rich recent returns on the other? Move quickly from reading to testing the numbers yourself, then weigh both the upside case and the concerns by checking the 2 key rewards and 2 important warning signs.
Want more ideas beyond General American Investors Company?
If General American Investors Company has sharpened your focus on price and quality, do not stop here. Broaden your watchlist with a few targeted hunting grounds using the Simply Wall Street Screener, so you are not relying on a single opportunity when better fits might already be waiting.
- Target resilient balance sheets and calmer risk profiles by scanning a 31 resilient stocks with low risk scores tailored to steadier performers.
- Hunt for strong cash generation and healthier finances by reviewing a list of solid balance sheet and fundamentals (24 results) that puts staying power front and center.
- Chase mispriced quality by checking a 19 high quality undiscovered gems that focuses on under-the-radar businesses with solid fundamentals.
Have feedback on this article? Concerned about the content? Get in touch with us directly. Alternatively, email editorial-team@simplywallst.com