


EN
Is Safety Insurance Group (SAFT) Expensive Following Its Third Quarter Earnings?
Safety Insurance Group (SAFT) just released third quarter results, reporting modestly higher revenue of $327.77 million and net income of $30.02 million, while nine month earnings remain below the prior year.
Recent pricing tells a calmer story. Safety Insurance Group’s share price is up strongly, with a year-to-date share price return of 37.83%, while the 1-year total shareholder return of 48.73% shows that income plus price gains have rewarded longer-term holders more than short-term traders.
Scan beyond Safety Insurance Group and compare this earnings move with a curated set of insurers screened for resilient balance sheets and fundamentals in our list of solid balance sheet and fundamentals (24 results).
The share price and recent earnings recovery put Safety Insurance Group in a very different spot compared with a year ago. Does that recent strength still leave enough upside in the valuation to justify new money stepping in?
Price-to-Earnings of 22.1x: Is it justified?
On simple valuation math, Safety Insurance Group trades on a P/E of 22.1x, which lines up closely with a peer average of 22.7x but sits well above the wider US insurance sector.
The P/E ratio compares the current share price to earnings per share. For an insurer like Safety Insurance Group, it is often used as a shorthand for what investors are prepared to pay for each dollar of profit in a business where growth expectations and underwriting discipline can vary widely.
A higher P/E often signals that shareholders are willing to pay up for perceived earnings resilience or potential improvement. In this case, the multiple comes against a backdrop of earnings that declined 12.1% per year over the past 5 years, a current net profit margin of 5.4% that is below last year’s 7.1%, and a Return on Equity of 7.8% that sits in the “low” bracket used in this framework.
Compared with the US insurance industry average of 11.8x, Safety Insurance Group’s 22.1x P/E is almost double. This implies a strong valuation premium. Put next to the peer group average of 22.7x, that premium fades and the stock looks more in line with companies that carry similar characteristics.
See what the numbers say about this price — find out in our valuation breakdown.
Result: Price-to-Earnings of 22.1x (ABOUT RIGHT)
Still, Safety Insurance Group faces clear pressure points, including earnings that declined 12.1% annually over 5 years and a current net margin that is below last year’s level.
Find out about the key risks to this Safety Insurance Group narrative.
Another view on Safety Insurance Group’s value
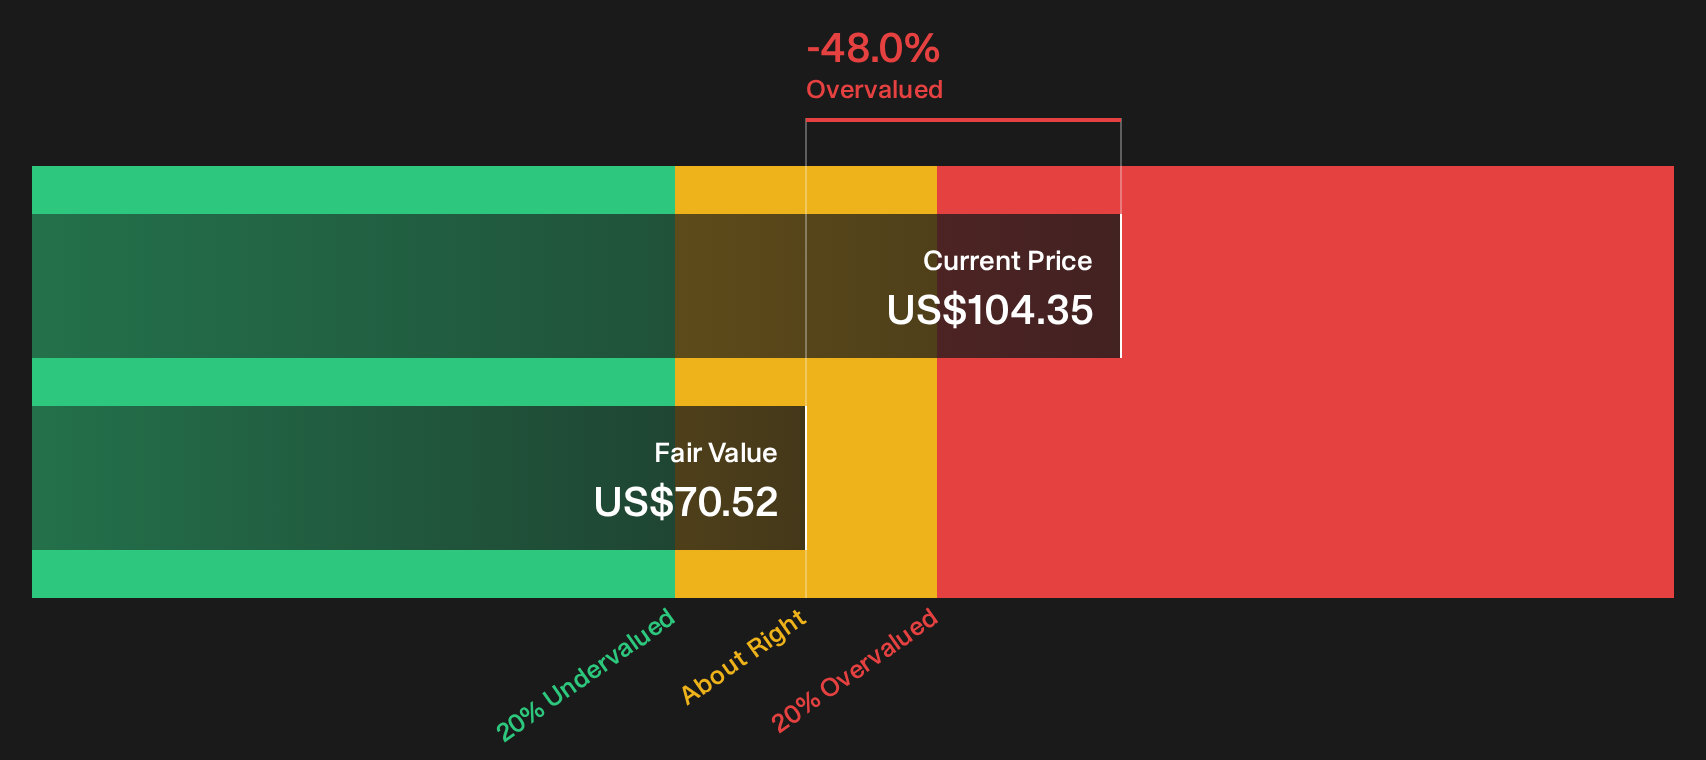
The first lens said Safety Insurance Group looked roughly in line with peers on a simple P/E. A different tool, our DCF model, lands in a very different place. At a share price of $104.35, the stock trades above an estimated future cash flow value of $70.52, which points to an overvalued reading on this framework.
That gap suggests investors today are paying a premium that the SWS DCF model does not fully back with projected cash generation. It raises a straightforward question for you: Are you comfortable paying more than this estimate, or does that premium feel like valuation risk?
Look into how the SWS DCF model arrives at its fair value.
Simply Wall St performs a discounted cash flow (DCF) on every stock in the world every day (check out Safety Insurance Group for example). We show the entire calculation in full. You can track the result in your watchlist or portfolio and be alerted when this changes, or use our stock screener to discover 35 high quality undervalued stocks. If you save a screener we even alert you when new companies match - so you never miss a potential opportunity.
Next Steps
Mixed signals on Safety Insurance Group’s value story so far. If you want to move fast and judge it on your own terms, start with the balance of risks and upsides highlighted in our latest view of 1 key reward and 1 important warning sign.
Looking for more investment ideas beyond Safety Insurance Group?
If Safety Insurance Group sharpened your focus on quality and price, do not stop here. Use structured stock lists to spot opportunities before the crowd moves.
- Target potential mispricing by scanning companies that combine robust fundamentals with appealing valuations through the 35 high quality undervalued stocks.
- Strengthen your income stream by reviewing businesses that pay sizeable yields in the 5 dividend fortresses.
- Dial down portfolio risk by concentrating on resilient businesses featured in the 31 resilient stocks with low risk scores.
Have feedback on this article? Concerned about the content? Get in touch with us directly. Alternatively, email editorial-team@simplywallst.com