


EN
Is Aflac (AFL) Fairly Valued As Leadership Changes Shape Its Succession Plan?
Aflac (AFL) has scheduled its next generation of leadership, outlining promotions across Aflac U.S., Aflac Japan and Aflac International that are intended to keep its insurance franchise on a steady track.
Recent trading has leaned positive for Aflac, with a 30-day share price return of 11.21% helping lift the stock to US$124.04 and contributing to a 12.52% share price gain year to date. The 1-year total shareholder return of 16.38% and 5-year total shareholder return of 146.79% point to momentum that has been sustained over multiple years as investors weigh succession plans, philanthropic activity and the broader insurance backdrop.
Scan how Aflac’s succession plans compare with peers by reviewing insurers on our handpicked 30 resilient stocks with low risk scores that screen strongly on balance sheet resilience and business fundamentals.
After a sharp move to US$124.04, Aflac now trades above the average analyst target, yet still screens at a discount on some intrinsic estimates. So where does fair value really land in that spread?
Most Popular Narrative: 5% Overvalued
Aflac closed at $124.04 against the most followed fair value estimate of $118.53, so the current narrative leans toward a modest premium that hinges on how capital deployment and investment income hold up.
The push in Japan to sell first sector savings products such as Tsumitasu, taking advantage of a steep yen yield curve and what management describes as extremely good post reinsurance new business IRRs, can offset slower third sector premium trends and support future revenue and earnings.
See why 44 investors see Aflac as 5% overvalued.
Result: Fair Value of $118.53 (OVERVALUED)
Still, that story can crack if Japan’s benefit ratios stay near the top of guidance, or if cybersecurity fallout in that market lingers longer than expected.
Find out about the key risks to this Aflac narrative.
Another View: Cash Flow Says Aflac Is Cheap
The analyst narrative describes Aflac as trading at a modest premium to its $118.53 fair value, yet the Simply Wall St DCF model reaches a very different conclusion. On that framework, Aflac at $124.04 trades around 28% below an estimated future cash flow value of $173.05. Which story do you think fits your own assumptions better?
If you want to see how this cash flow view is built line by line, run your eye over the Look into how the SWS DCF model arrives at its fair value..
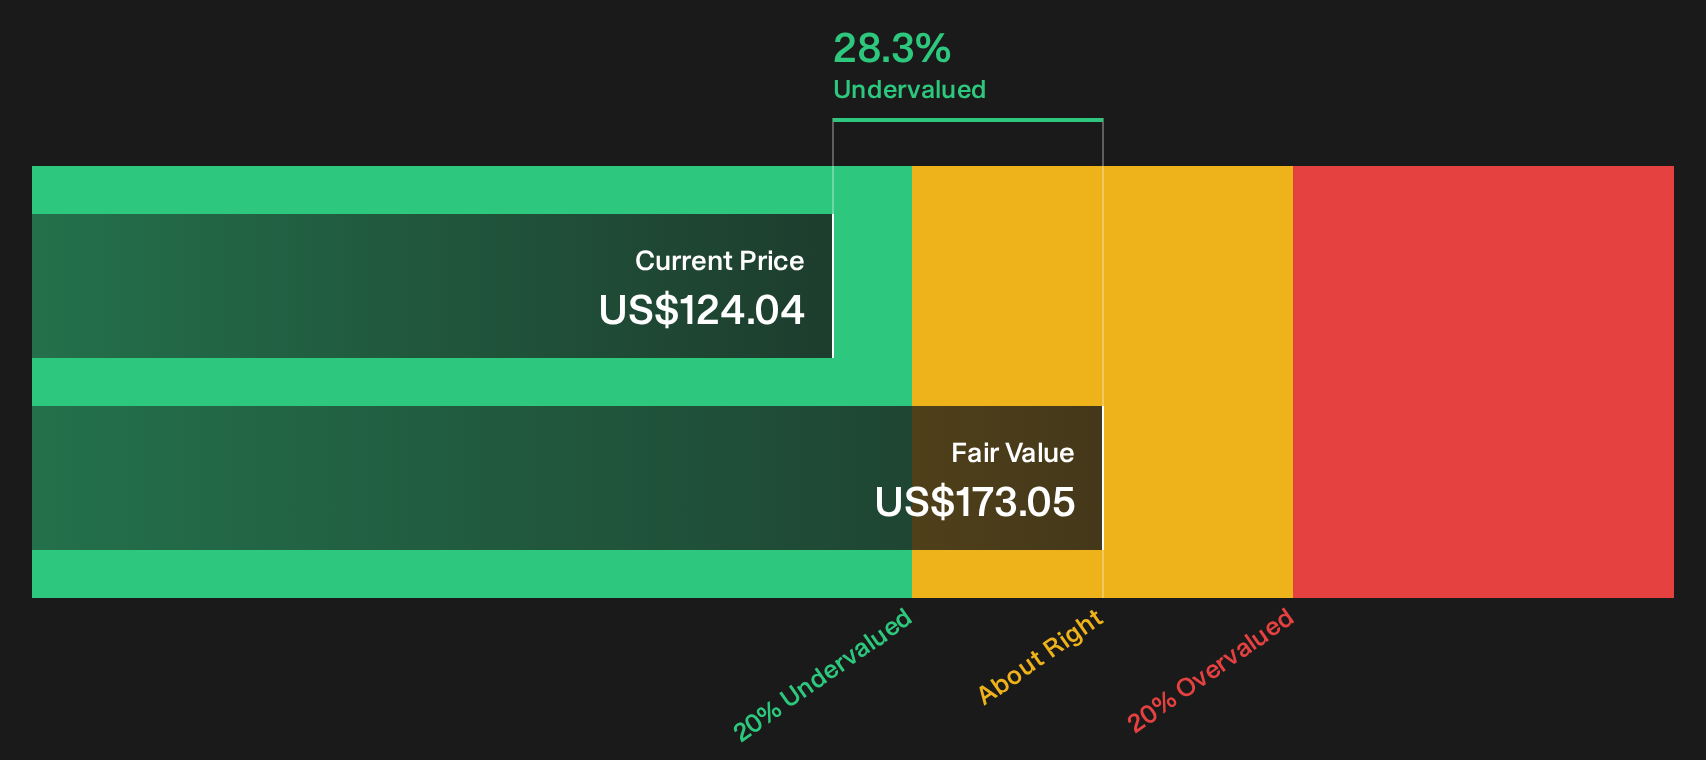
Simply Wall St performs a discounted cash flow (DCF) on every stock in the world every day (check out Aflac for example). We show the entire calculation in full. You can track the result in your watchlist or portfolio and be alerted when this changes, or use our stock screener to discover 35 high quality undervalued stocks. If you save a screener we even alert you when new companies match - so you never miss a potential opportunity.
Next Steps
Mixed messages on Aflac’s value story. If you want to move quickly from headlines to hard evidence, compare the 3 key rewards and 2 important warning signs with your own expectations.
Looking for more investment ideas beyond Aflac?
If Aflac has you thinking about portfolio upgrades, do not stop with a single ticker. Fresh ideas often come from scanning outside your usual watchlist.
Use the Simply Wall St Screener to quickly sort through opportunities that match your style, risk comfort and return goals so promising candidates do not slip past you.
- Target potential mispricings by reviewing companies on the 35 high quality undervalued stocks that combine strong fundamentals with prices that still lag their underlying metrics.
- Build more dependable income streams by hunting for resilient payers in the 4 dividend fortresses that focus on yield alongside balance sheet strength.
- Strengthen portfolio resilience by scanning the list of solid balance sheet and fundamentals (23 results) and concentrating on businesses with robust finances that can better handle unexpected shocks.
Have feedback on this article? Concerned about the content? Get in touch with us directly. Alternatively, email editorial-team@simplywallst.com