


EN
Merchants Bancorp (MBIN) Could Be 160% Below Fair Value Following Stronger Q3 Results
Merchants Bancorp (MBIN) drew attention after its third quarter update on 28 October 2026, as earnings, net interest income and charge offs all moved in directions investors tend to watch closely.
Merchants Bancorp’s share price has climbed 56.21% year to date, with a 7 day share price return of 5.50% showing fresh momentum even after a 1 day dip of 1.58%. Over a longer stretch, total shareholder return of 63.64% over the past year signals that the recent earnings update and lower charge offs are being viewed as material shifts in the risk and reward profile, rather than a one quarter blip.
Spot 30 resilient stocks with low risk scores that, like Merchants Bancorp, pair earnings resilience with balance sheet strength and reduced credit losses.After a 56% year to date climb and a share price of $51.83, Merchants Bancorp now trades well below both analyst targets and some intrinsic value estimates. Is that gap still justified by the fundamentals just reported?
Price-to-Earnings of 8.5x: Is it justified?
On the numbers, Merchants Bancorp looks inexpensive on earnings compared to its peer set, even after a strong share price run in 2026.
The preferred gauge here is the P/E ratio, which sits at 8.5x for Merchants Bancorp. For a diversified financial group generating $279.2m in net income on $703.4m of revenue and reporting a 39.7% net margin, that earnings multiple is being applied to a business that has grown profits by 3.2% per year over five years, with a 39.8% increase in the most recent year.
The P/E of 8.5x is materially lower than the peer average of 10.4x and significantly below the broader US Diversified Financial industry at 16x. The Simply Wall St fair P/E estimate of 10.6x indicates that the market is pricing Merchants Bancorp below the level suggested by that model, assuming sentiment on its earnings quality and growth profile were to align with it.
Explore the SWS fair ratio for Merchants Bancorp.
Result: Price-to-Earnings of 8.5x (UNDERVALUED)
Still, the share price has slipped 4.1% over 90 days, and Merchants Bancorp remains exposed to shifts in US multi-family credit quality and mortgage warehousing demand.
Find out about the key risks to this Merchants Bancorp narrative.
Another View: Merchants Bancorp Through A Cash Flow Lens
The earnings multiple presents Merchants Bancorp as inexpensive, and the SWS DCF model provides an additional perspective. Using forecast future cash flows, it indicates a fair value of $134.80 per share compared with the current $51.83. That gap suggests a very large implied discount. Is the market overreacting to perceived risk, or is the model too optimistic?
Look into how the SWS DCF model arrives at its fair value.
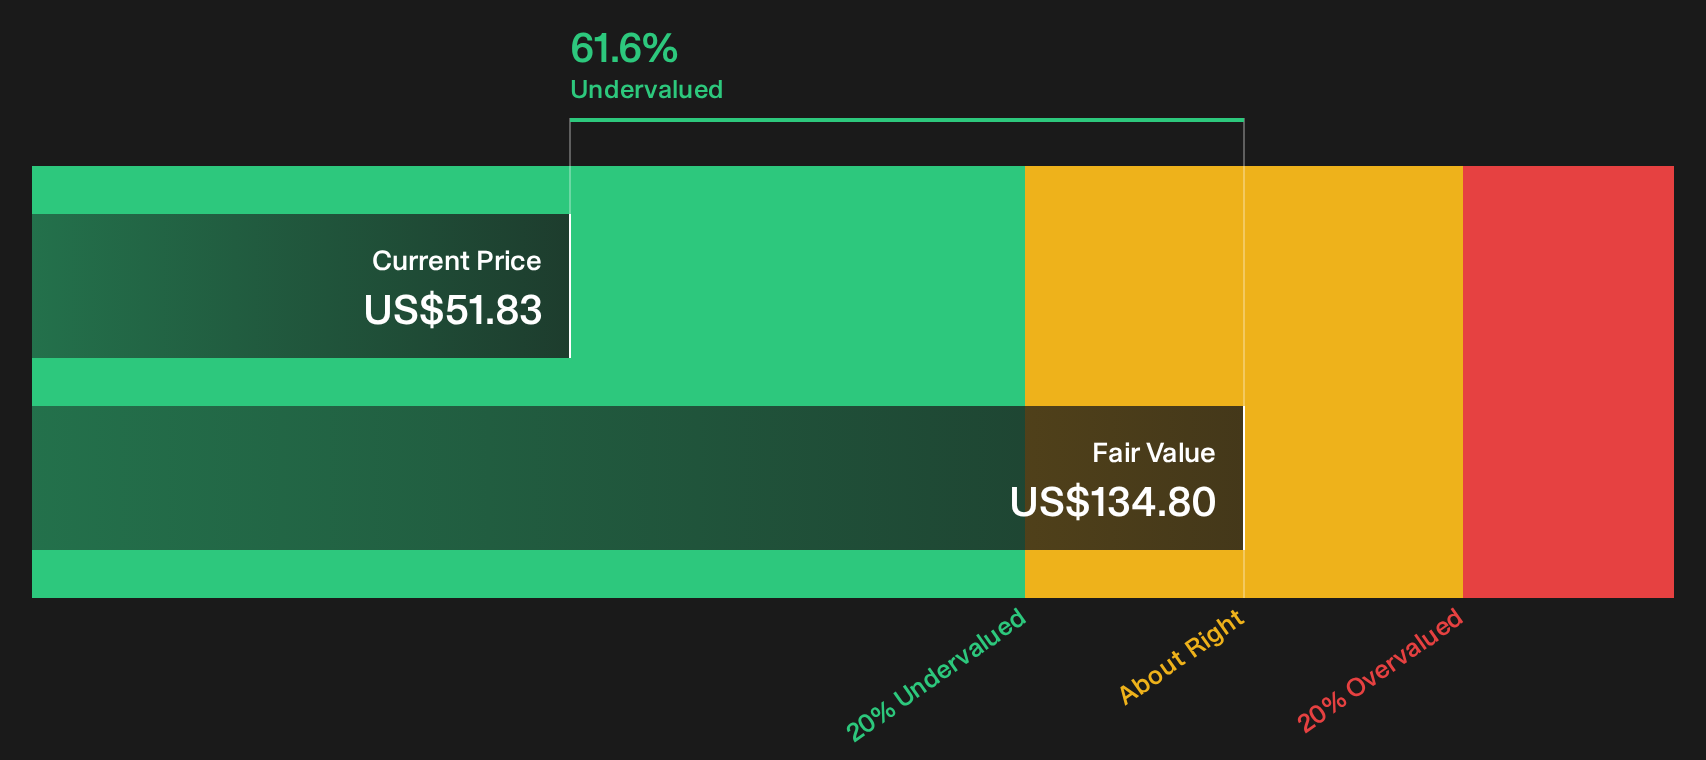
Simply Wall St performs a discounted cash flow (DCF) on every stock in the world every day (check out Merchants Bancorp for example). We show the entire calculation in full. You can track the result in your watchlist or portfolio and be alerted when this changes, or use our stock screener to discover 35 high quality undervalued stocks. If you save a screener we even alert you when new companies match - so you never miss a potential opportunity.
Next Steps
With sentiment looking split between opportunity and risk after Merchants Bancorp’s latest update, move quickly, test the numbers yourself, and pressure test the story from both sides with the 4 key rewards and 1 important warning sign
Looking for more ideas beyond Merchants Bancorp?
Do not stop at Merchants Bancorp. Use the Simply Wall St screener to scout fresh opportunities, compare quality, and assess where your next dollar really belongs.
- Target strong pricing gaps by scanning for companies trading below intrinsic value using the 35 high quality undervalued stocks.
- Build a sturdier core by filtering for businesses with healthy leverage, liquidity, and coverage on the list of solid balance sheet and fundamentals (23 results).
- Search for lesser known opportunities with robust fundamentals through the 19 high quality undiscovered gems.
Have feedback on this article? Concerned about the content? Get in touch with us directly. Alternatively, email editorial-team@simplywallst.com