


EN
MGE Energy (MGEE) Rebounds In The Short Term, Does It Look Fairly Valued?
MGE Energy (MGEE) has been drawing fresh attention after recent price moves that leave the stock trading near US$73.93, with performance over the past month and the past 3 months pointing in different directions.
Recent trading paints a mixed picture. The share price slipped around 1.9% on the day and is still down about 5.8% year to date, yet a 4.5% 30 day share price return sits against a 1 year total shareholder return that has declined roughly 9%. This hints that short term momentum has picked up while longer term returns remain muted.
Look beyond MGE Energy's mixed recent performance and review hand picked 30 resilient stocks with low risk scores that may better match your appetite for steadier returns and more resilient balance sheets.
MGE Energy now trades a little below analyst targets, while its recent rebound trails longer term weakness. Is that discount pointing to opportunity, or simply reflecting justified caution on the regulated utility’s outlook and valuation?
Price-to-Earnings of 18.7x: Is it justified?
MGE Energy trades on a P/E of 18.7x, which keeps the share price near $73.93 while raising questions about how much future profit is already reflected.
The P/E ratio compares the current share price to earnings per share and, for a regulated utility like MGE Energy, often signals what investors are willing to pay for relatively steady profits. A higher figure usually implies the market is comfortable paying up for predictability, while a lower one can suggest either caution or a lack of enthusiasm for future growth.
For this stock, the picture is mixed. On one side, the P/E of 18.7x is slightly below the US Electric Utilities industry average of 19.4x, which points to a modest discount against peers. On the other side, a fair P/E estimate of 16.7x sits beneath the current multiple, so the shares trade richer than the level the market could potentially move toward if sentiment cooled.
Explore the SWS fair ratio for MGE Energy.
Result: Price-to-Earnings of 18.7x (ABOUT RIGHT)
Still, the recent share price rebound could stall if regulated returns face pressure or if higher capital spending weighs on sentiment toward MGE Energy.
Find out about the key risks to this MGE Energy narrative.
Another View on MGE Energy's Value
The SWS DCF model paints a tougher picture for MGE Energy. On this view, the stock at $73.93 sits well above an estimated future cash flow value of $48.13. This points to a materially richer price and raises the question of how much safety margin investors really have.
Look into how the SWS DCF model arrives at its fair value.
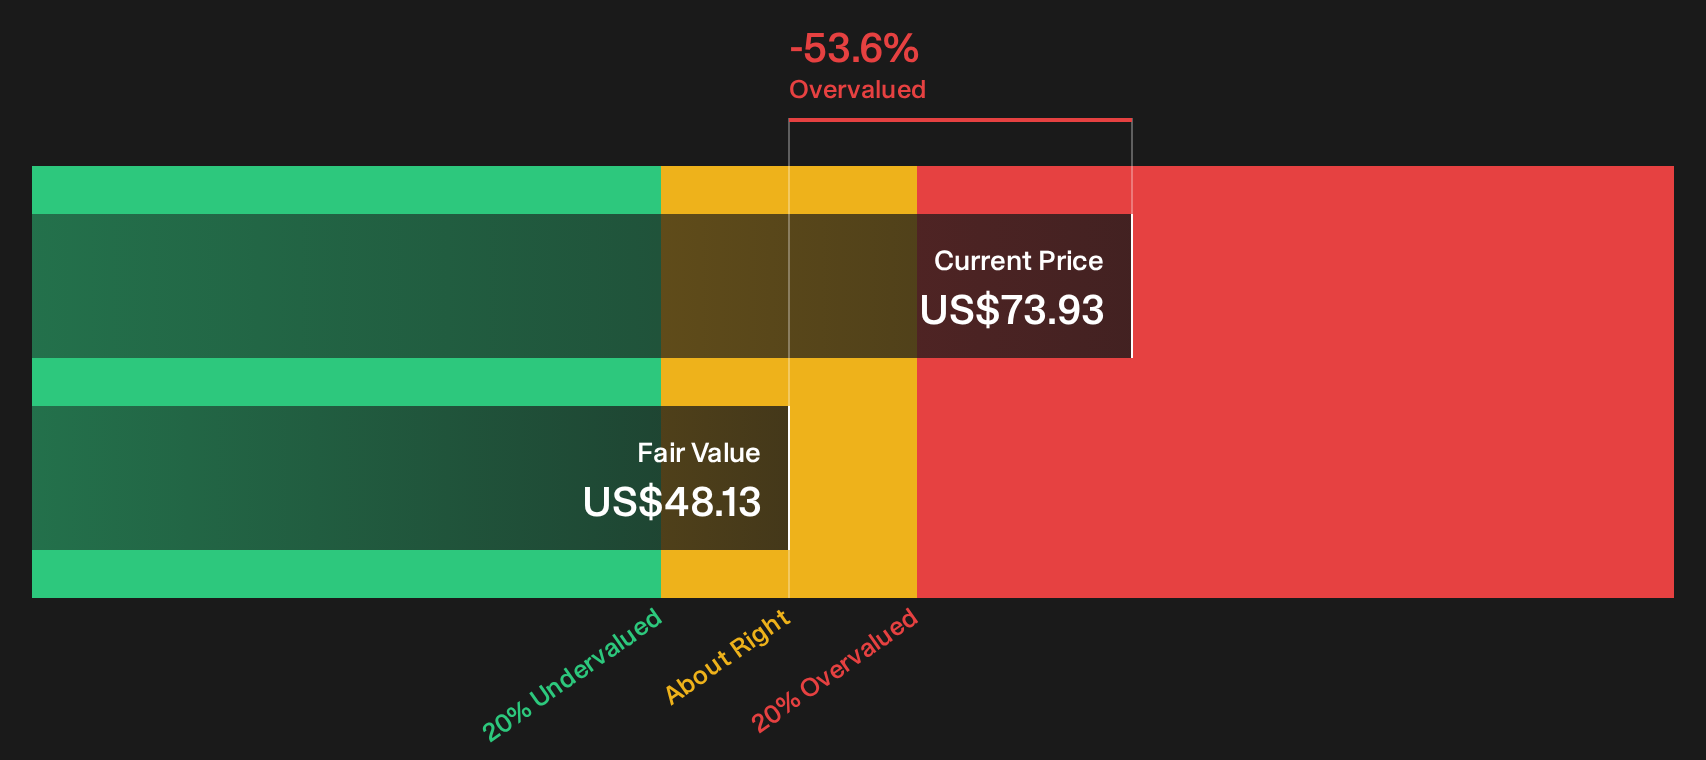
Simply Wall St performs a discounted cash flow (DCF) on every stock in the world every day (check out MGE Energy for example). We show the entire calculation in full. You can track the result in your watchlist or portfolio and be alerted when this changes, or use our stock screener to discover 35 high quality undervalued stocks. If you save a screener we even alert you when new companies match - so you never miss a potential opportunity.
Next Steps
Mixed messages on MGE Energy can feel like a warning or an opening, so act promptly, review the data yourself, and weigh up the 3 key rewards and 2 important warning signs
Looking for more investment ideas beyond MGE Energy?
If MGE Energy has you reassessing your next move, do not stop at one ticker. Use curated screeners to uncover clearer setups that better suit your goals.
- Target stronger value opportunities by scanning a curated pool of companies with robust fundamentals using the 35 high quality undervalued stocks.
- Lock in potential income ideas by focusing on companies with higher yields and sturdier payout profiles through the 4 dividend fortresses.
- Prioritise financial resilience by filtering for businesses with cleaner balance sheets and healthier cash profiles in the list of solid balance sheet and fundamentals (23 results).
Have feedback on this article? Concerned about the content? Get in touch with us directly. Alternatively, email editorial-team@simplywallst.com