


EN
Capital Power (TSX:CPX) Posts Record EBITDA, Is It Still Undervalued?
Capital Power (TSX:CPX) just posted record adjusted EBITDA for the third quarter, along with a 2% bump to its common dividend, putting income strength and cash generation in clear focus for investors.
Despite the headline earnings softness and higher maintenance spend, Capital Power’s share price has inched higher, with a 1 month share price return of 3.74% and a year to date share price return of 5.81% to CA$63.76. In contrast, a 1 year total shareholder return that declined 4.68% contrasts with very strong 3 and 5 year total shareholder returns above 90%, suggesting shorter term momentum has cooled even as the longer term story has rewarded patient holders.
Compare Capital Power’s income profile and cash generation with a curated group of grid-focused utilities and infrastructure plays in our 42 power grid technology and infrastructure stocks
The recent uptick in Capital Power’s share price sits awkwardly against softer headline earnings and heavier maintenance spend. Is this move backing the underlying cash engine, or is it simply a change in sentiment that the valuation now needs to test?
Most Popular Narrative: 18% Undervalued
On the most followed narrative, Capital Power screens as undervalued, with a fair value of CA$77.46 against the latest close at CA$63.76. This puts the debate squarely on whether embedded EBITDA can genuinely turn into visible cash generation under a 7.6% discount rate.
The company has identified about $1.25b of embedded annual adjusted EBITDA upside in its current portfolio, with hundreds of millions tied to recontracting, capacity upgrades and merchant exposure in markets such as Alberta and PJM, which could translate into higher EBITDA and earnings without requiring equivalent new capital spending.
See why 47 investors see Capital Power as 18% undervalued.
Result: Fair Value of CA$77.46 (UNDERVALUED)
Still, the picture for Capital Power can change quickly if higher sustaining capex, financing costs, or heavy maintenance outages continue to pressure free cash generation.
Find out about the key risks to this Capital Power narrative.
Another View on Capital Power’s Valuation
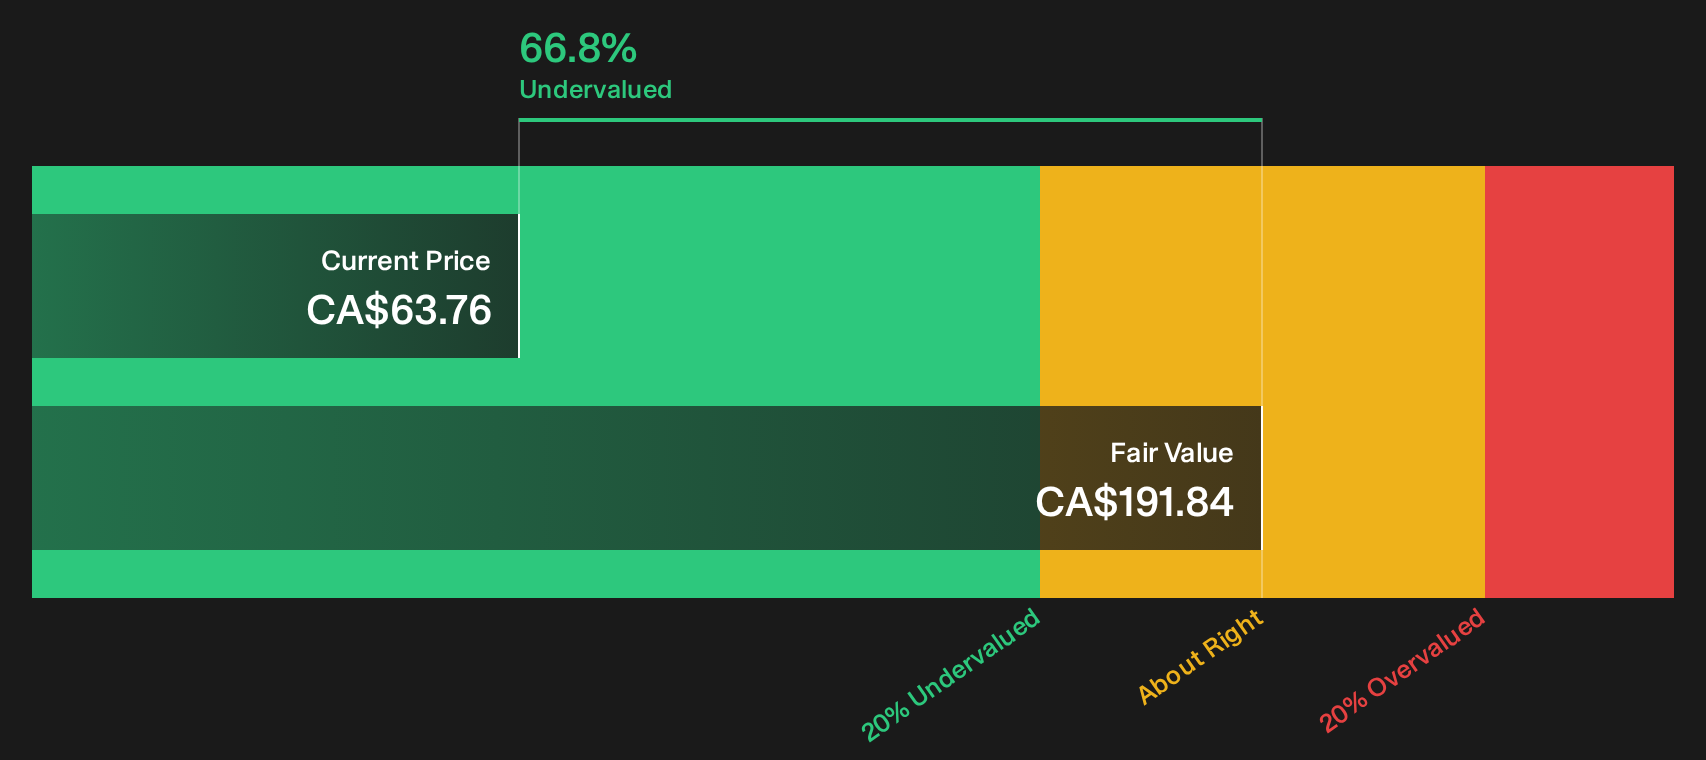
There is a sharp contrast between the analyst fair value of CA$77.46 and Simply Wall St’s DCF output, which prices Capital Power’s future cash flows at CA$191.84 per share. That gap flags a lot of room between a conventional target and what the SWS DCF model suggests. Which anchor do you treat as your reference point?
Look into how the SWS DCF model arrives at its fair value.
Next Steps
If the mixed mood around Capital Power leaves you unsure, quickly review the underlying data, consider both the potential downsides and upsides, and focus on 3 key rewards and 4 important warning signs.
Looking for more investment ideas beyond Capital Power?
If Capital Power’s story caught your attention, do not stop here. Use fresh screeners to spot other opportunities before the crowd gets to them.
- Target potential mispricing by checking companies that pass a quality and valuation filter through our 4 high quality undervalued stocks.
- Explore income-focused ideas by reviewing businesses with strong payouts in the 3 dividend fortresses.
- Prioritize resilience by scanning for companies with sturdy finances in the list of solid balance sheet and fundamentals (6 results).
Have feedback on this article? Concerned about the content? Get in touch with us directly. Alternatively, email editorial-team@simplywallst.com