


EN
Vornado Realty Trust (VNO) Stock Falls As Q3 Results Revive Balance Sheet Concerns
Vornado Realty Trust stock closed at US$33.87, off about 3% on the day, as investors reacted quickly to its Q3 2026 earnings release. That pullback came even as funds from operations, the key profit yardstick for a real estate investment trust, pointed to a stronger cash engine in the New York portfolio.
In the short term, the move reflects nerves around a business that is still reporting losses on a basic earnings per share line. Over a multi year lens, the main story is the pressure on interest coverage and the balance sheet, which now matters as much as any headline FFO beat.
Love the stronger FFO engine in Vornado Realty Trust but worried about the pressure on interest coverage and a stretched balance sheet? Compare this setup with our list of solid balance sheet and fundamentals stocks (23 results).
Q3 2026 Earnings Summary
- Revenue (Q3 2026 vs. Q3 2025): US$467.7 million vs. US$475.6 million (slight decline in top line)
- Net Income/Loss (Q3 2026 vs. Q3 2025): loss of US$47.1 million vs. profit of US$11.6 million (moved back into the red)
- Basic EPS (Q3 2026 vs. Q3 2025): loss of US$0.25 per share vs. earnings of US$0.06 per share (swing from profit to loss)
- Funds From Operations, or FFO, (Q3 2026 vs. Q3 2025): US$154.6 million vs. US$117.0 million (indicating stronger cash generation from the property portfolio)
Vornado says New York is now the strongest office market in America. Ask Charlie what’s really driving Vornado’s New York office surge.
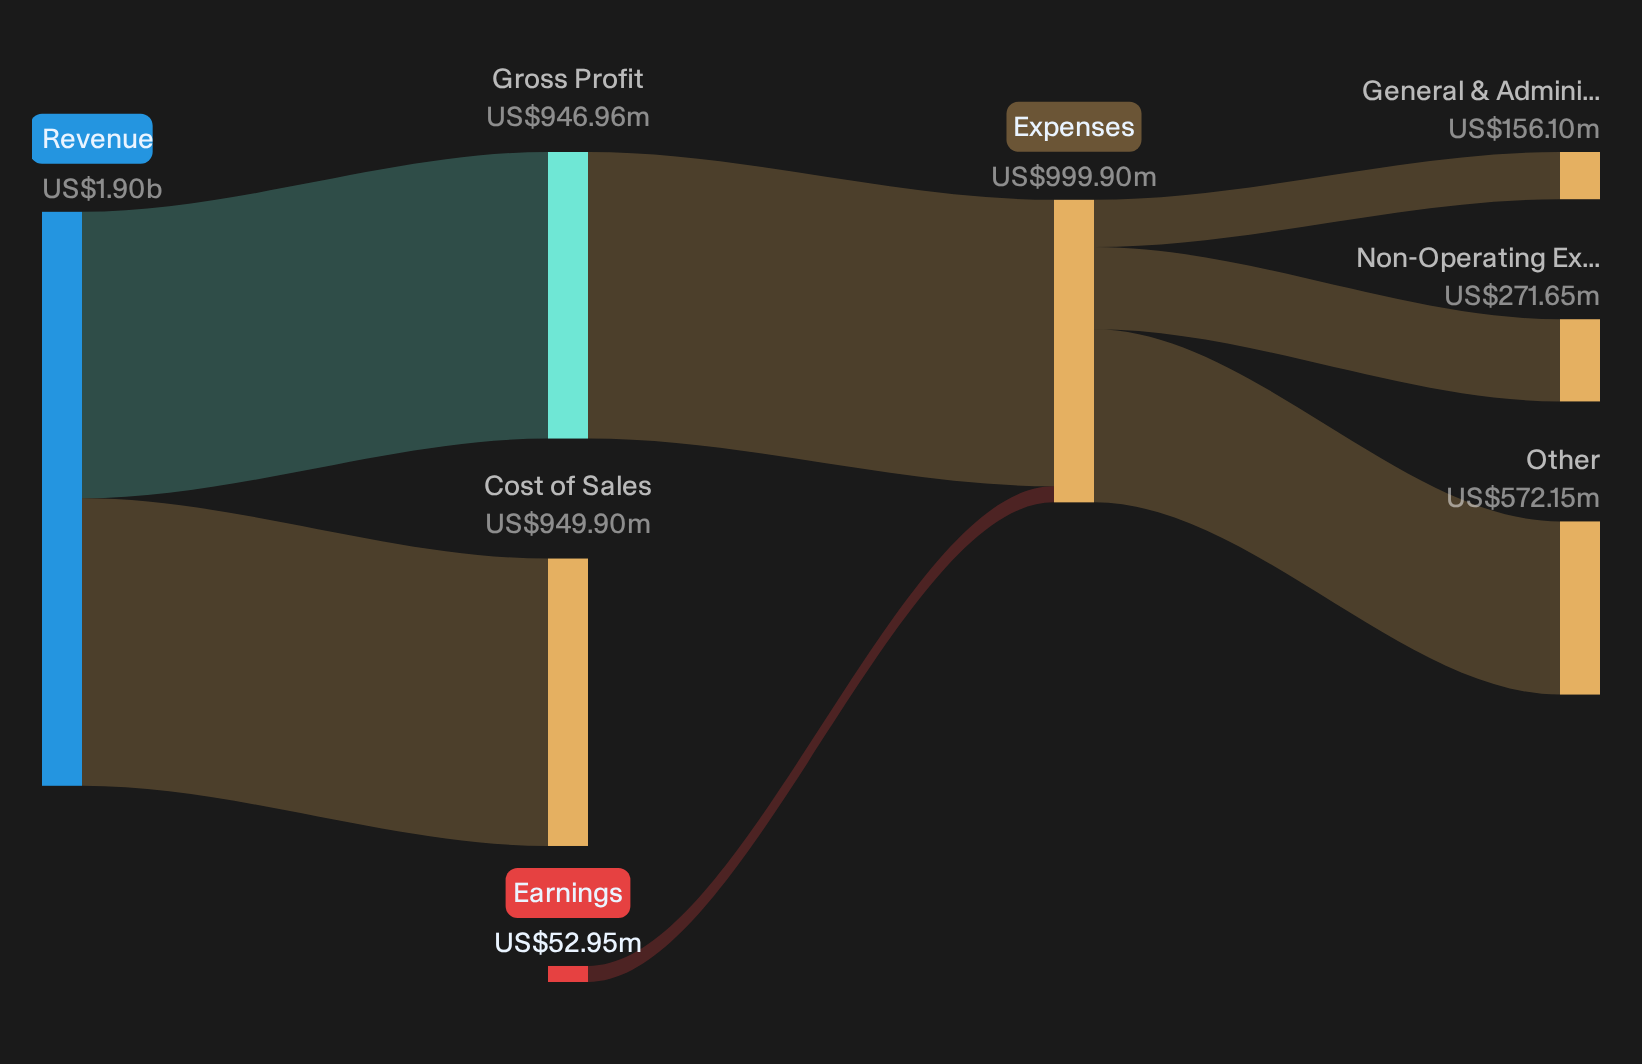
Vornado’s Rent Commencement Story Meets Hard Metrics
The bullish script for Vornado Realty Trust rests on signed leases translating into visible cash flow and better earnings quality rather than just hopeful rent talk.
"Signed but not yet commenced leases of about US$180 million to US$200 million of annual rent, with roughly 10% to 12% expected to start each quarter over the next couple of years, create a staggered rent commencement profile that can lift Vornado Realty Trust revenue and FFO without requiring incremental leasing wins."
Q3 results align with that narrative. Comparable FFO per share rose to US$0.65, and management now pegs signed but not yet recognized revenue at roughly US$204m. New York office occupancy improved to 93% and same store NOI, net operating income, grew by a double-digit rate. That reflects the leasing engine starting to show through the income statement.
That disagreement has a full argument behind it. → Uncover the higher Fair Value this Narrative argues for.
Vornado Leverage Fears Meet Funded Projects Reality
Bearish views argue that even if Vornado Realty Trust executes on leasing, lenders and capex still capture most of the economic upside.
"Although Vornado Realty Trust is benefiting from a tight high quality Manhattan office market with low vacancy and tenants willing to pay premium rents for better buildings, elevated leverage near 8x debt to EBITDA and billions of dollars of upcoming maturities could divert more rental income toward interest and refinancing costs, limiting the extent to which revenue growth converts into higher free cash flow."
Q3 shows this concern is only partly playing out. Comparable FFO per share rose to US$0.65 and New York same store NOI grew at high single to low double digit rates, so earnings power is moving up. At the same time, net income swung to a US$47.1m loss and the share price fell roughly 3% on the print, which signals that higher interest expense and balance sheet strain remain unresolved milestones for Vornado Realty Trust rather than risks that have faded.
Hunt For Mispriced Cash Engines
Vornado Realty Trust shows how earnings power and balance sheet questions can influence a stock in different ways. The real opportunity is spotting companies that could be undervalued before fresh information prompts markets to reassess them.
- Company 1 - 30% below our estimate - builds AI centric networking and data center systems that convert one off hardware sales into recurring consumption based contracts.
- Company 2 - 35% below our estimate - scales a tech enabled device recommerce platform as subsidies and changing consumer habits push more phones into formal trade in channels.
- Company 3 - 25% below our estimate - ramps high value optical manufacturing capacity as AI driven data center clients shift larger volumes into outsourced production.
That is three of the list. See all 35 potentially undervalued companies →
Have feedback on this article? Concerned about the content? Get in touch with us directly. Alternatively, email editorial-team@simplywallst.com